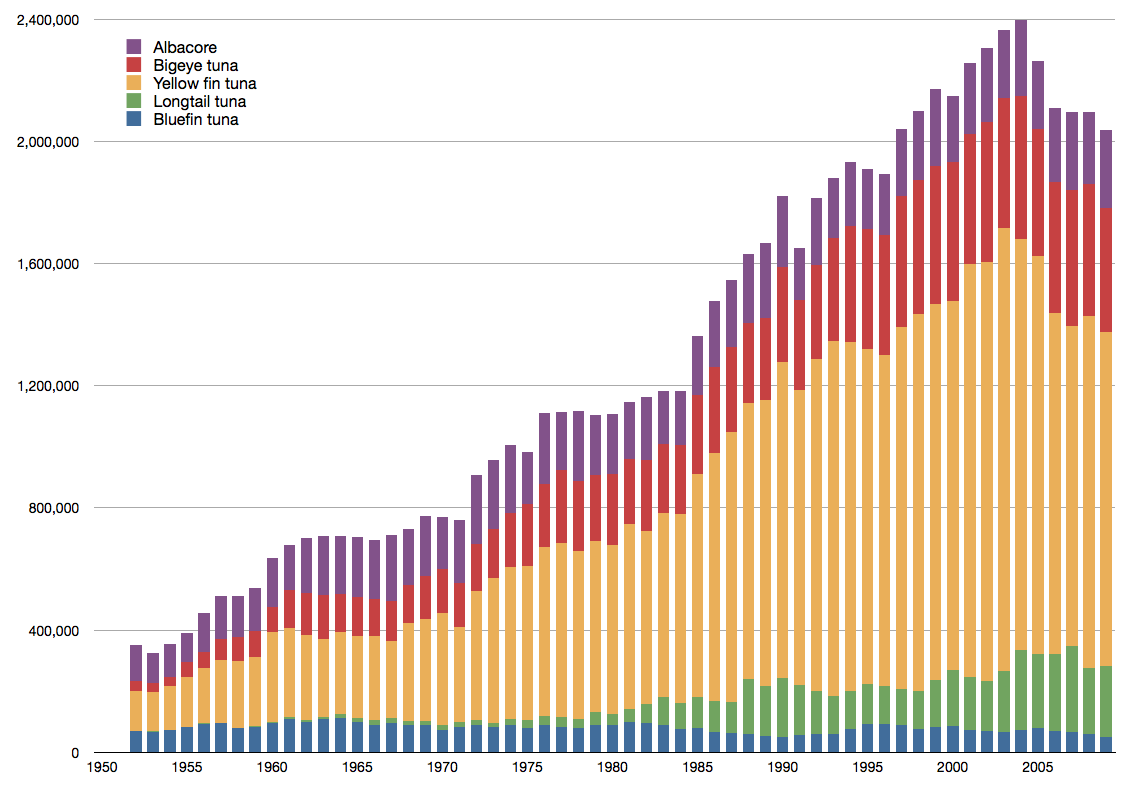
The image shows a bar chart depicting the number of people who have died in a car accident.
Read full description
The image shows a bar chart depicting the number of people who have died in a car accident. The chart is composed of different colored bars, each representing a different year, with the height of each bar indicating the amount of people affected by the accident. Text is also present on the chart, providing further information about the data.