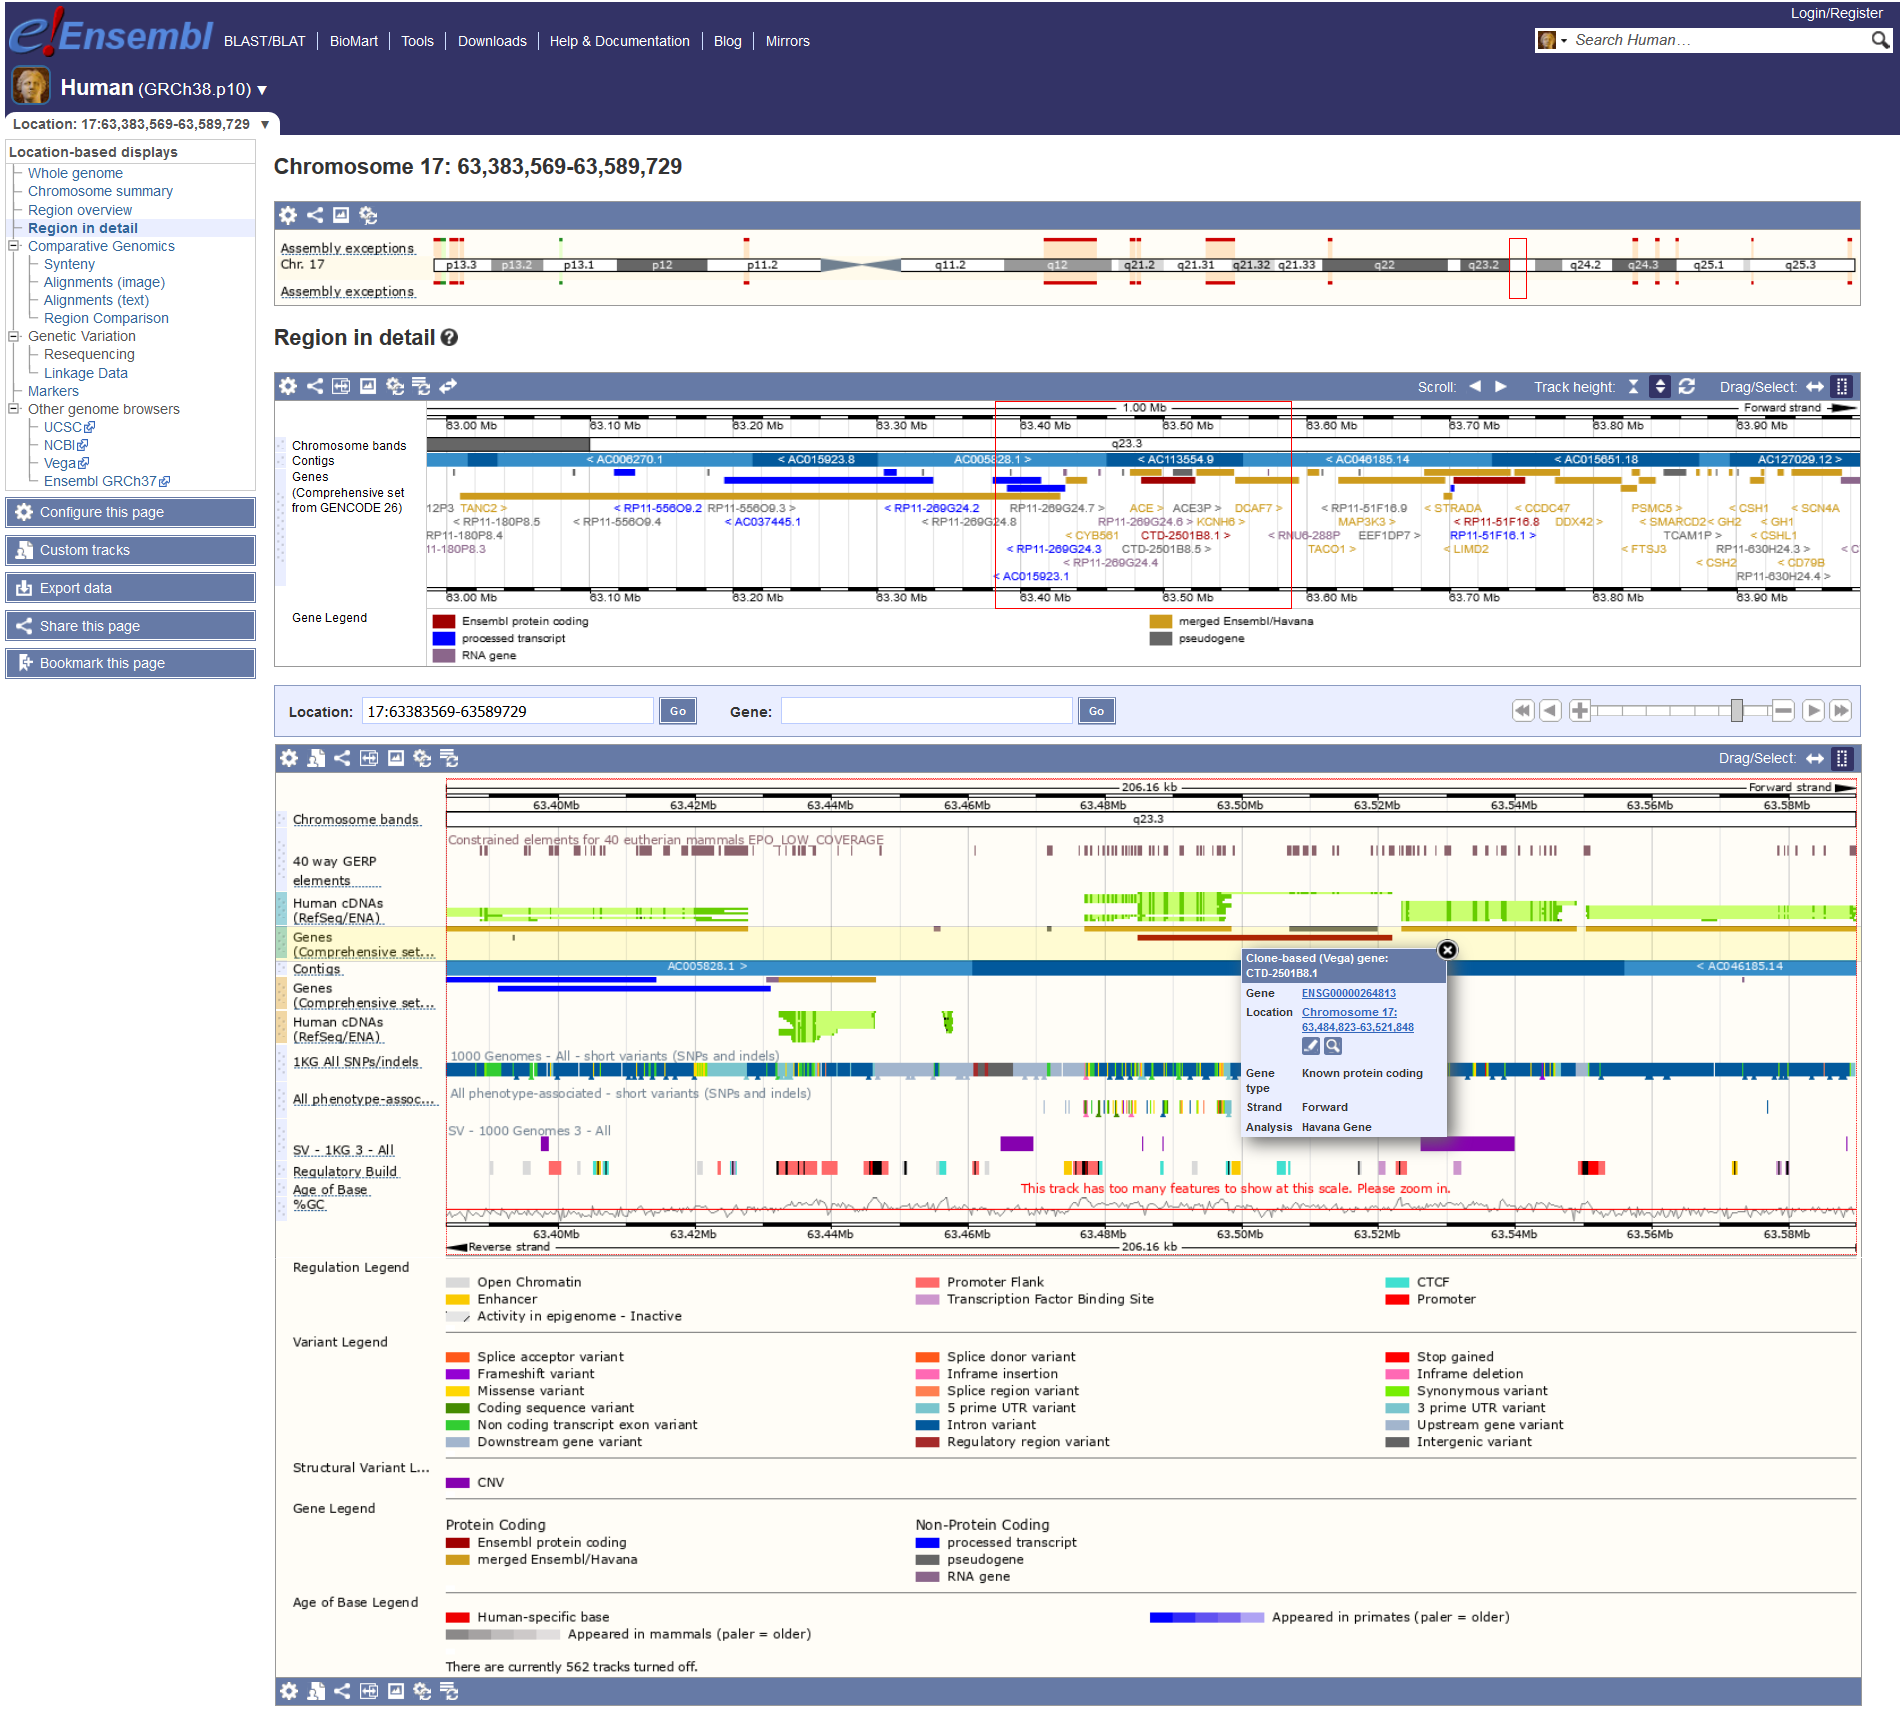
The image shows a computer screen with a gantt chart displayed on it.
Read full description
The image shows a computer screen with a gantt chart displayed on it. The chart is composed of multiple rows and columns of data, each representing a different type of data. The data is organized in a neat and orderly fashion, with each row and column clearly labeled and organized. The colors used in the chart are vibrant and eye-catching, making it easy to read and understand.