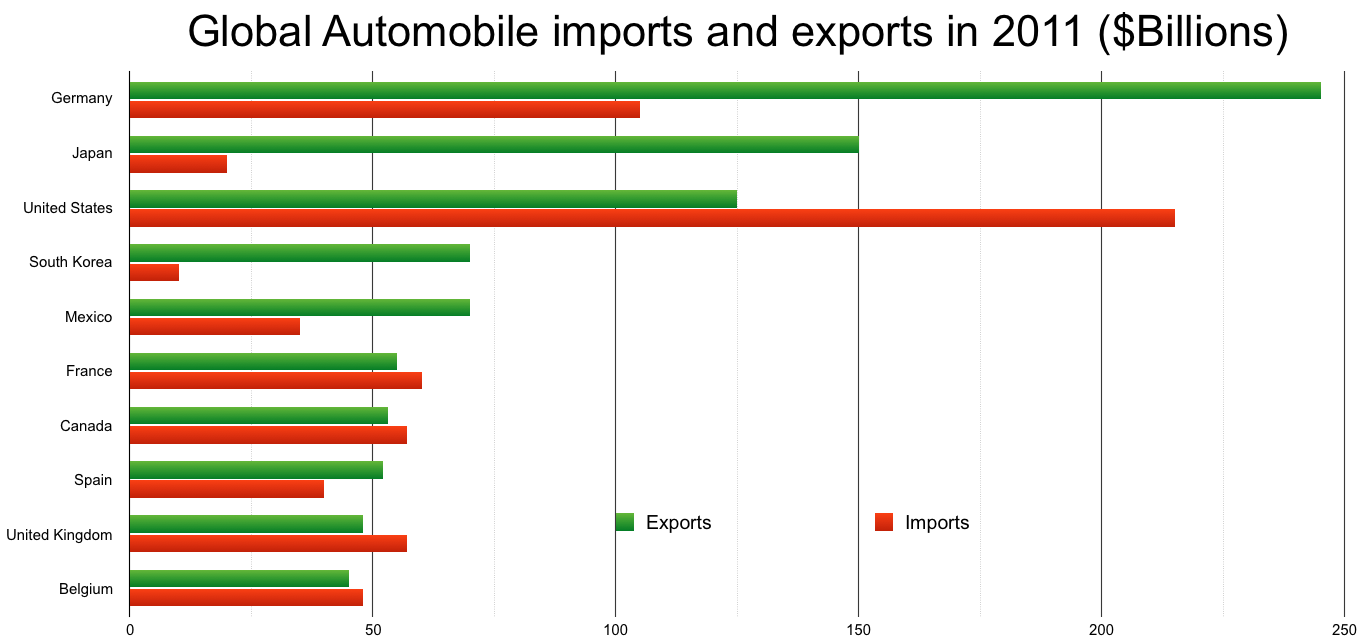
The image shows a bar chart depicting the global automobile imports and exports in 2011, with the text indicating the amount of money spent in each country.
Read full description
The image shows a bar chart depicting the global automobile imports and exports in 2011, with the text indicating the amount of money spent in each country. The chart is composed of several bars of varying heights, each representing a different country, with each bar representing a year. The colors of the bars vary, with some being shades of blue, green, yellow, and red. The text is written in a bold font and is centered at the top of the chart.