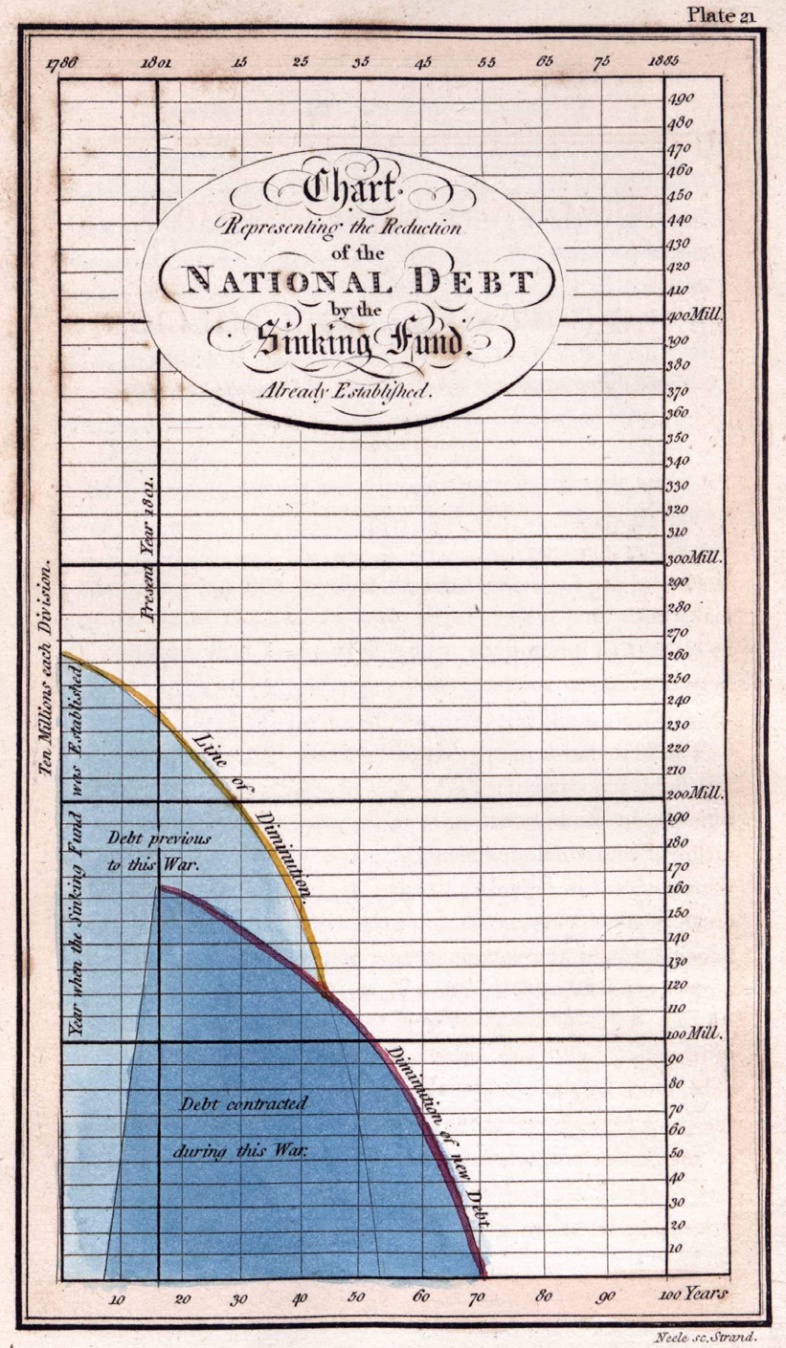
The image shows an old book with a graph on it, depicting the national debt by the sinking fund.
Read full description
The image shows an old book with a graph on it, depicting the national debt by the sinking fund. The graph is composed of a series of points connected by a line, with the x-axis representing the amount of debt and the y-axis indicating the rate of sinking. The text on the paper provides further information about the graph, such as the total amount of money spent on the sinking and the percentage of people who have been affected by it.