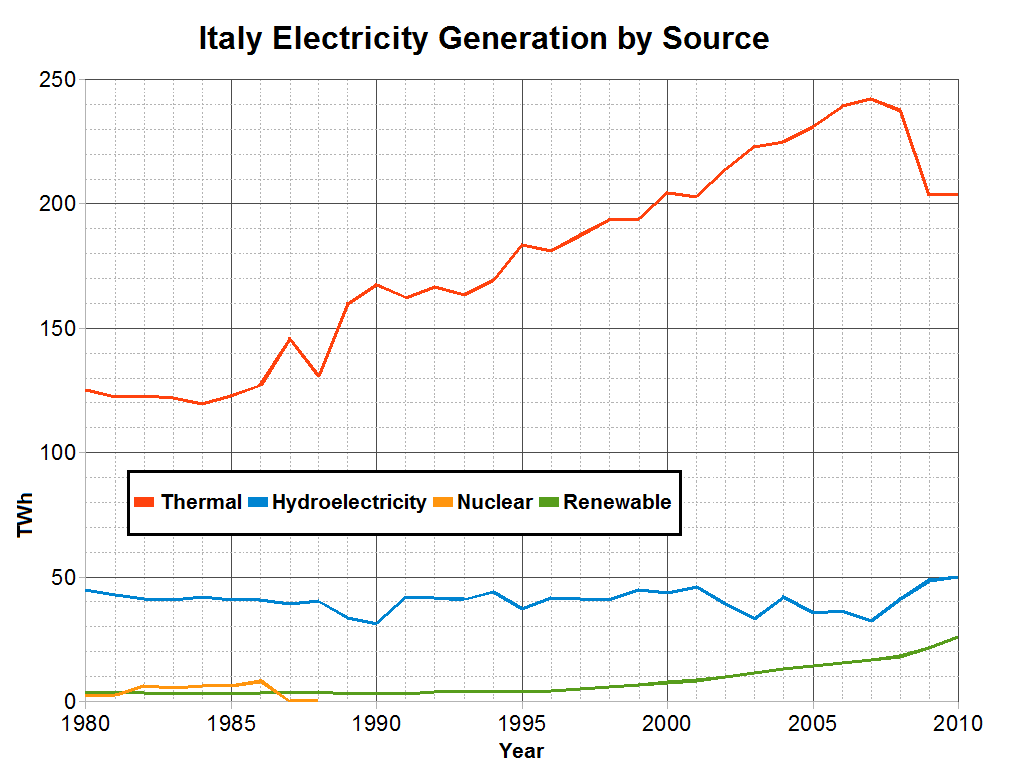
The image shows a graph depicting Italy's electricity generation by source.
Read full description
The image shows a graph depicting Italy's electricity generation by source. The graph is composed of a series of bars, each representing a different source of electricity, with the x-axis representing the years and the y-axis indicating the amount of electricity generated. The bars are labeled with the source of the source, such as "electricity," "nuclear," and "renewable." The graph also includes a legend at the bottom that explains the meaning of each bar.