Read full description
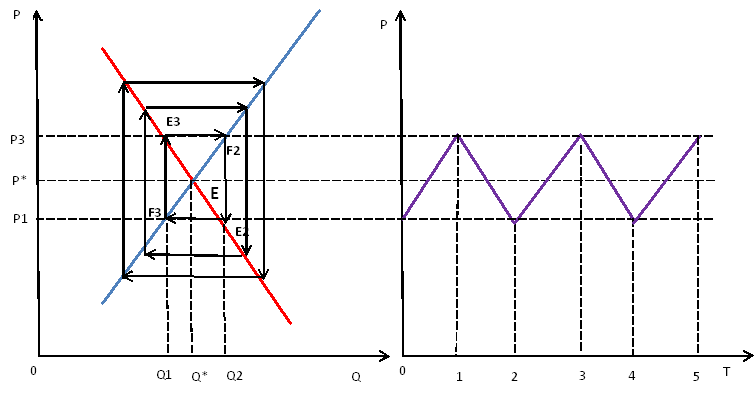
The image shows a diagram of a supply and demand curve with a red arrow pointing to the left and a blue arrow pointing up, indicating the equilibrium of the two variables. The background of the image is white, and there is some text accompanying the diagram.