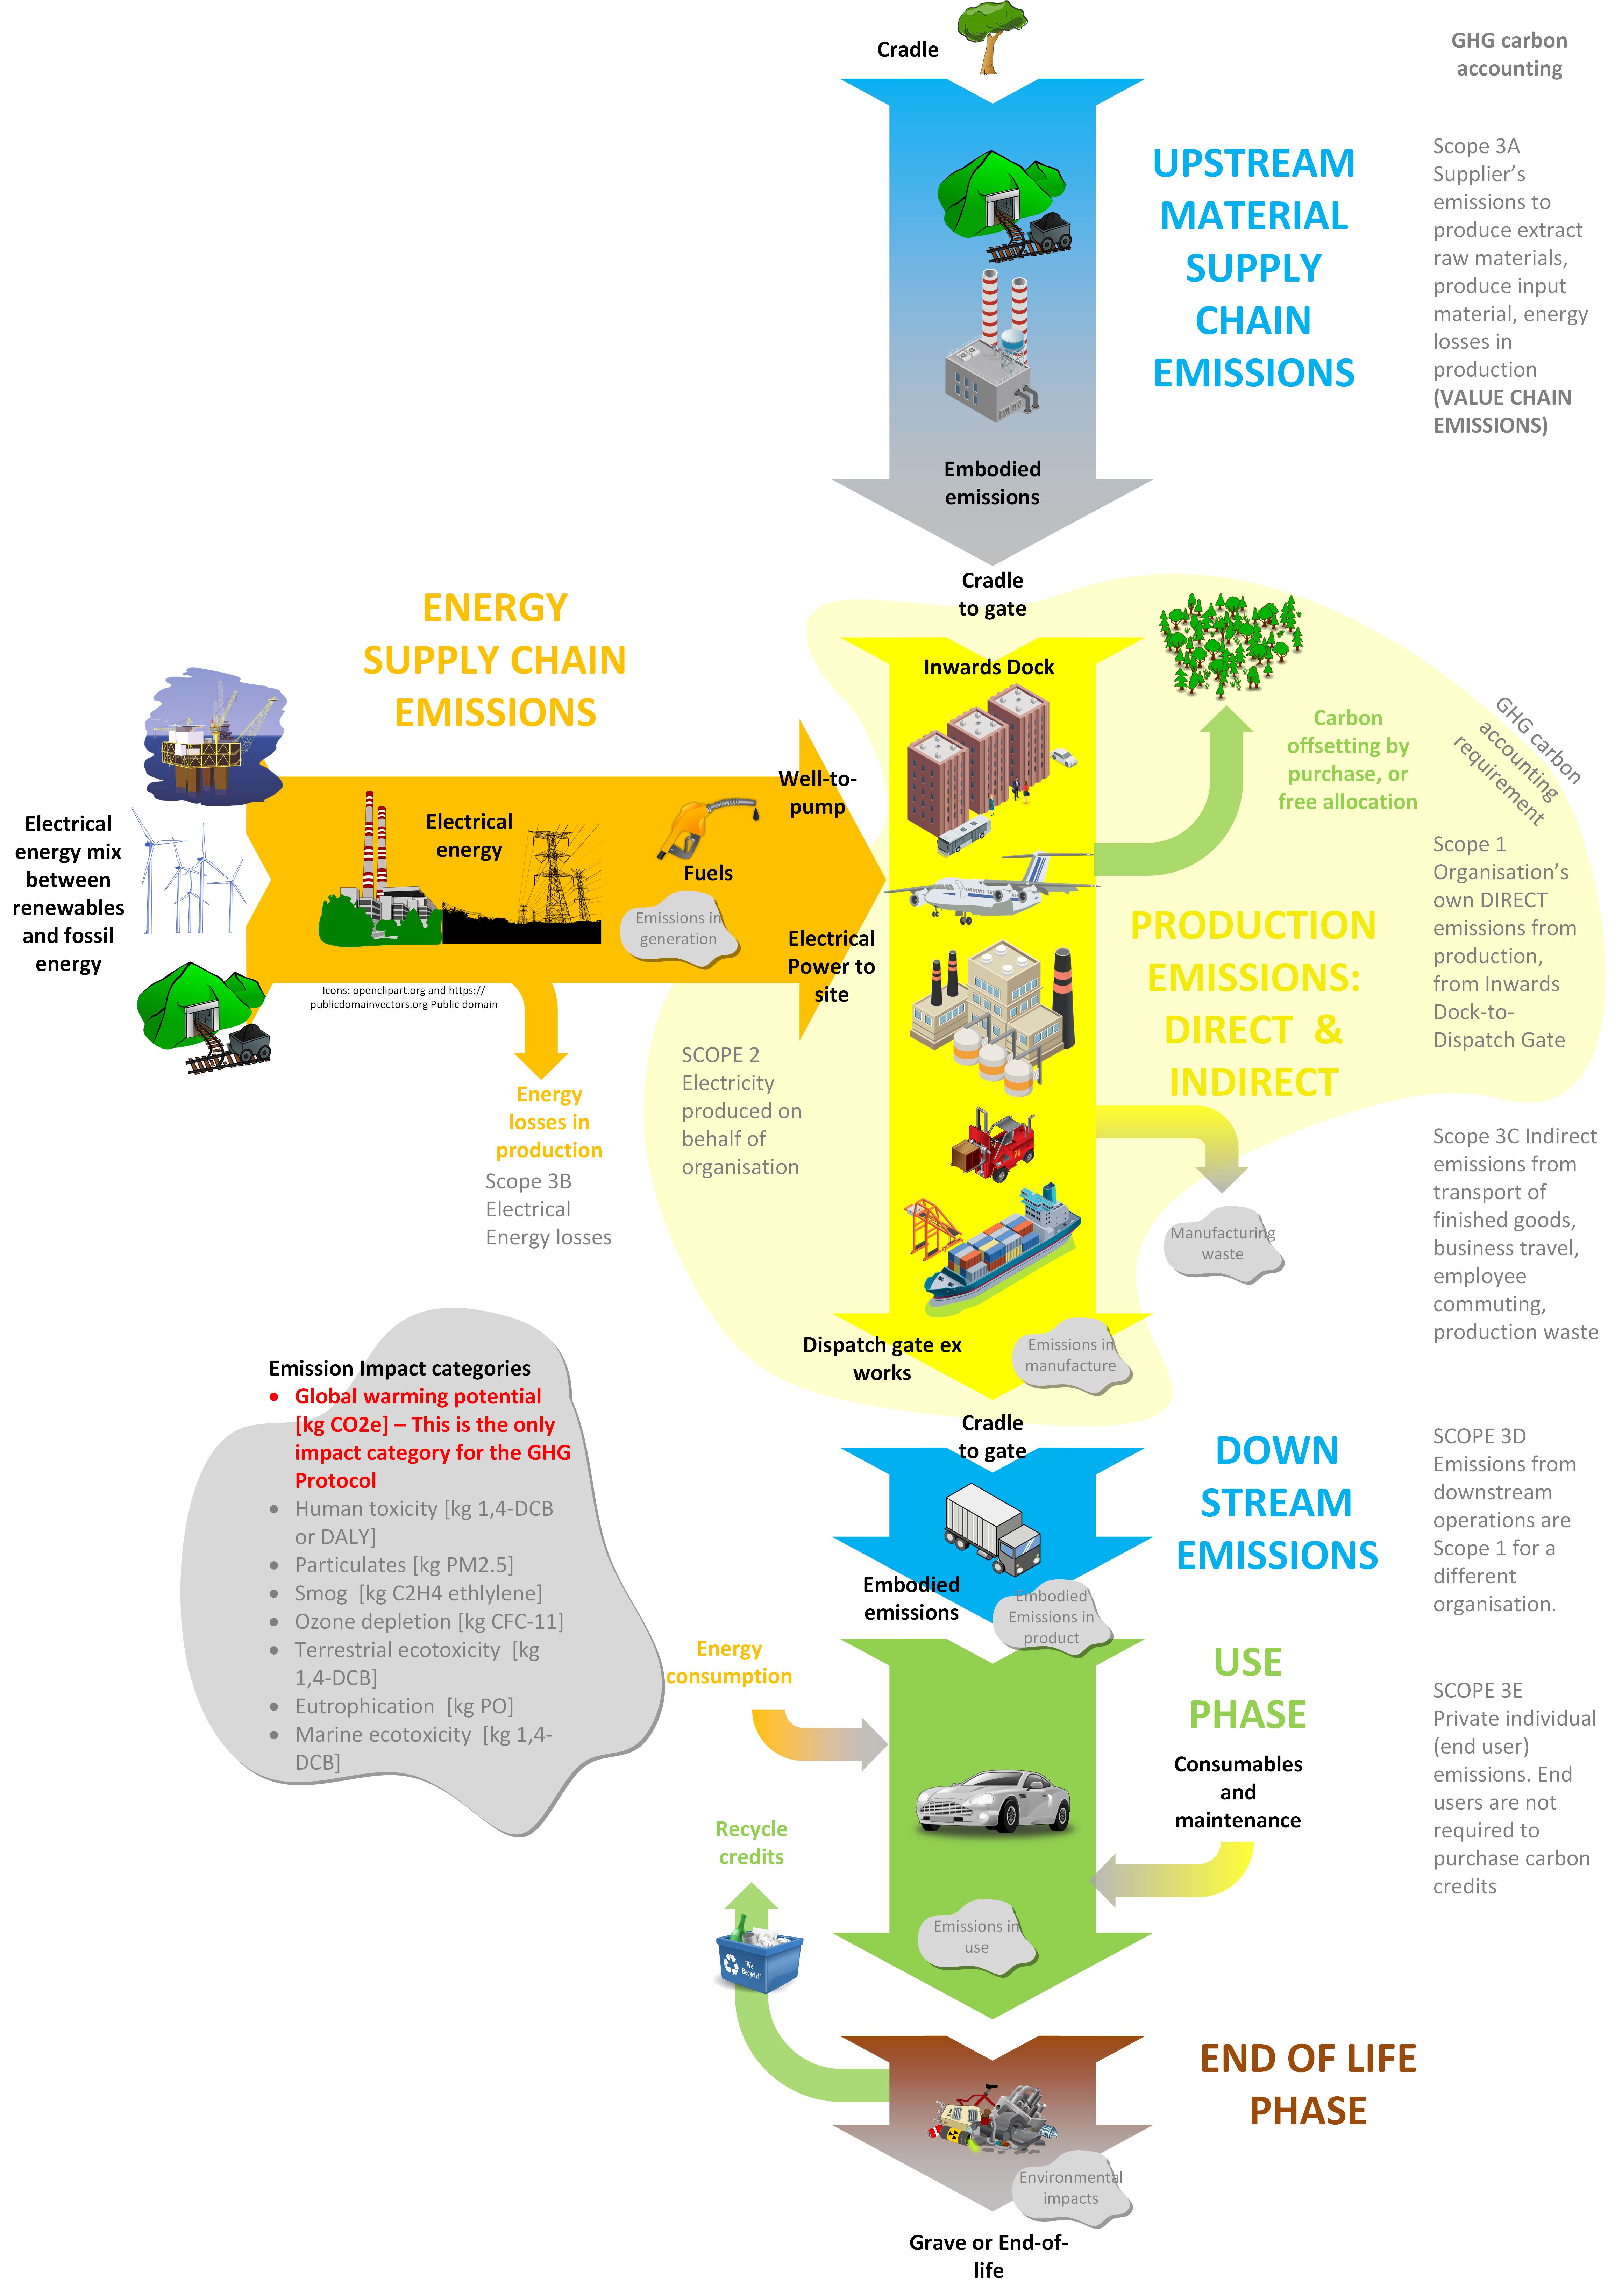
The image shows a diagram of the energy supply chain, with text and images of vehicles, trees, and other objects.
Read full description
The image shows a diagram of the energy supply chain, with text and images of vehicles, trees, and other objects. It is a flowchart that illustrates the process of energy production, with the vehicles and trees representing the various stages of the process. The text provides further details about the process, such as the amount of energy produced, the types of emissions, and the steps involved.