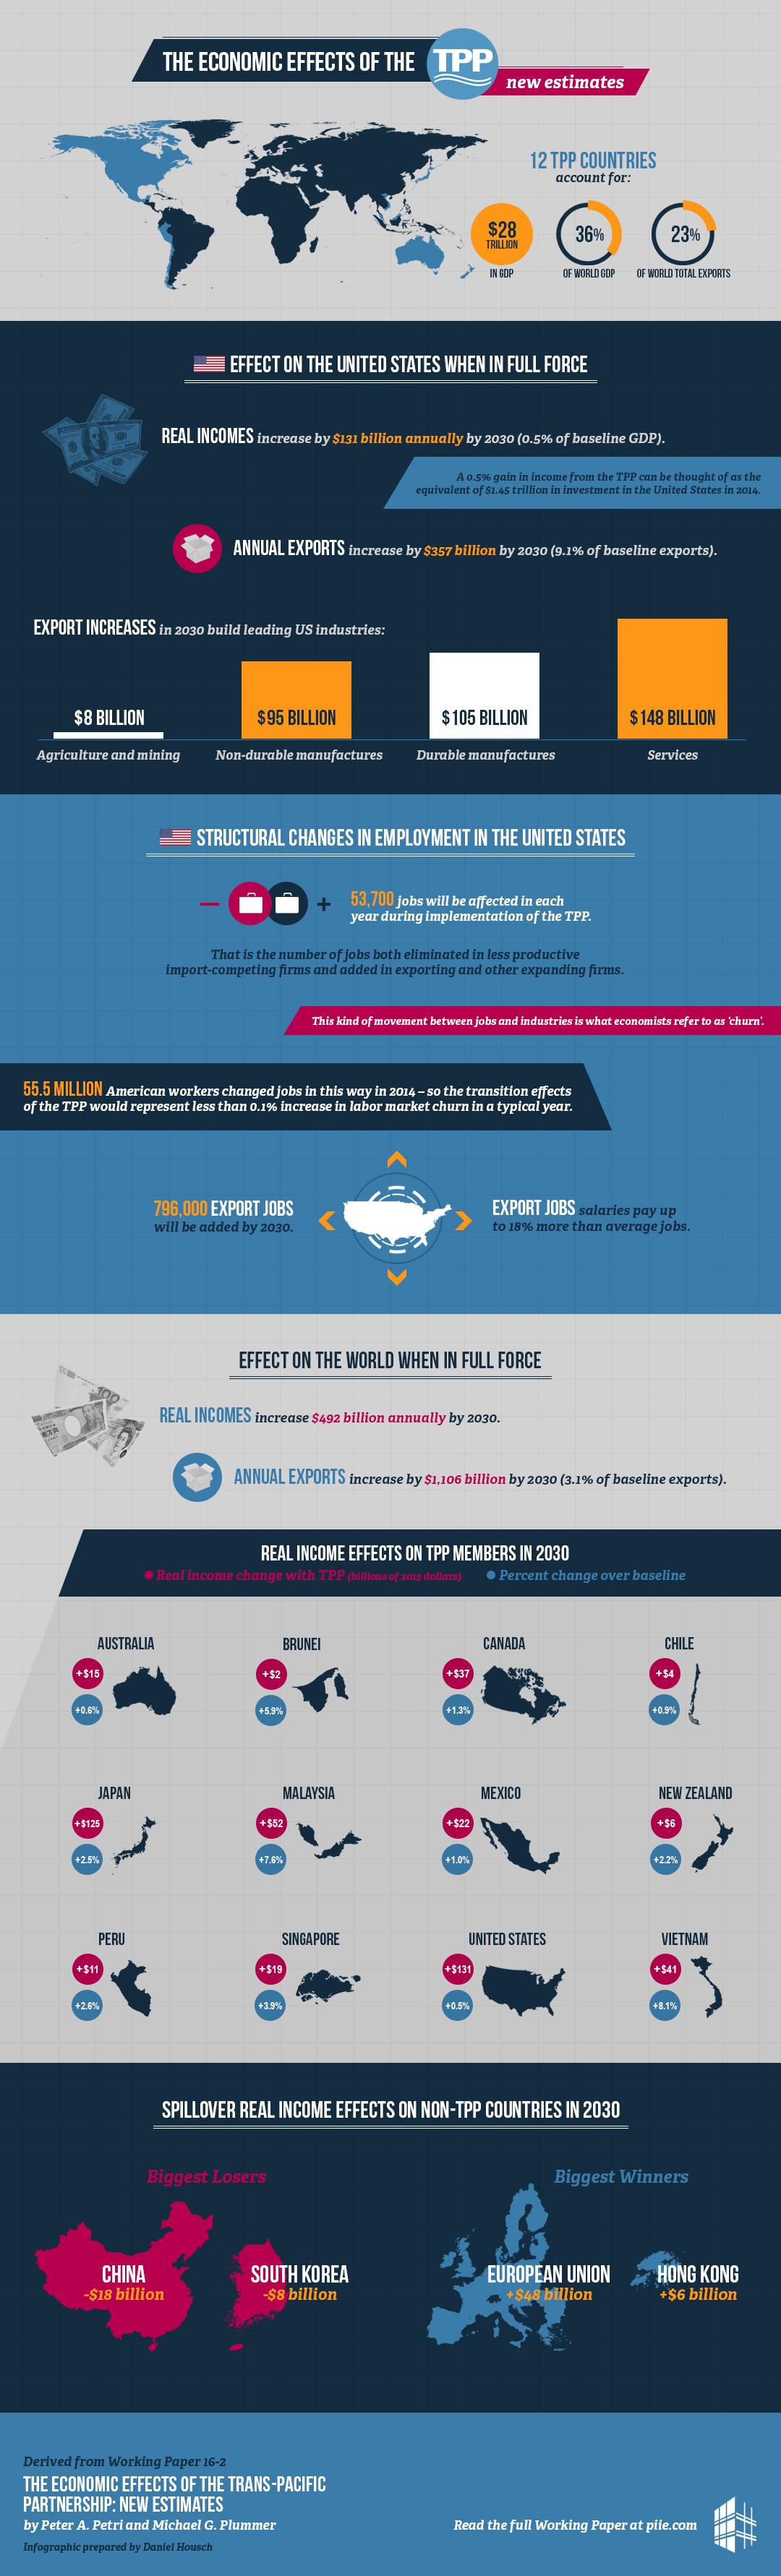
The image shows an infographic poster depicting the economic effects of the TPP.
Read full description
The image shows an infographic poster depicting the economic effects of the TPP. It features a map of the world with various countries highlighted in different colors, along with text that explains the various economic impacts of the United States. The map is divided into different sections, each representing a different country, and each section is further divided into subsections that provide further information about the economic impact of theTPP on the economy. The infographic also includes statistics such as the number of people affected by the TPP, the amount of money spent on goods and services, and the impact it has had on the global economy.