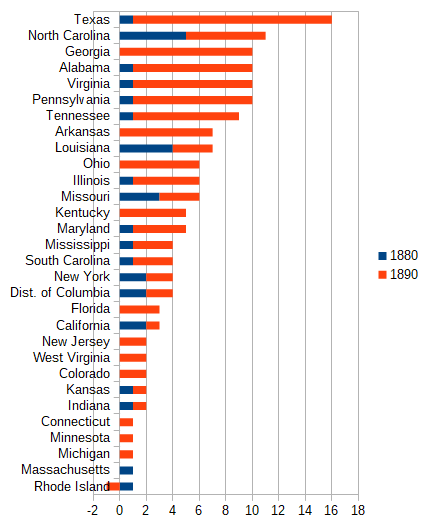
The image shows a bar chart depicting the number of people who have been diagnosed with cancer in the United States.
Read full description
The image shows a bar chart depicting the number of people who have been diagnosed with cancer in the United States. The chart is divided into sections, each representing a different state, and the height of each section indicates the percentage of people diagnosed with the disease.