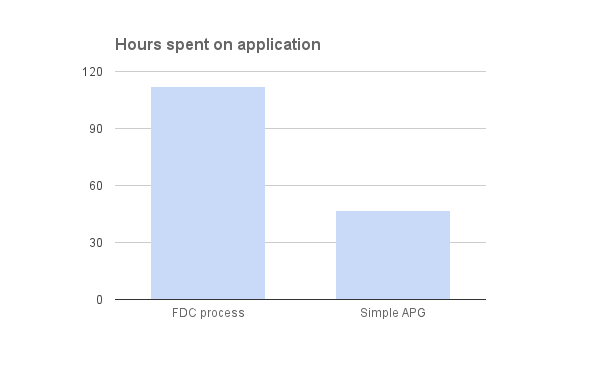
The image shows a bar chart depicting the amount of hours spent on an application.
Read full description
The image shows a bar chart depicting the amount of hours spent on an application. The chart is divided into two sections, one labeled "FDC" and the other labeled "APG". The bars are labeled with the corresponding hours spent, and the height of each bar indicates the percentage of hours that have been spent on the application.