Read full description
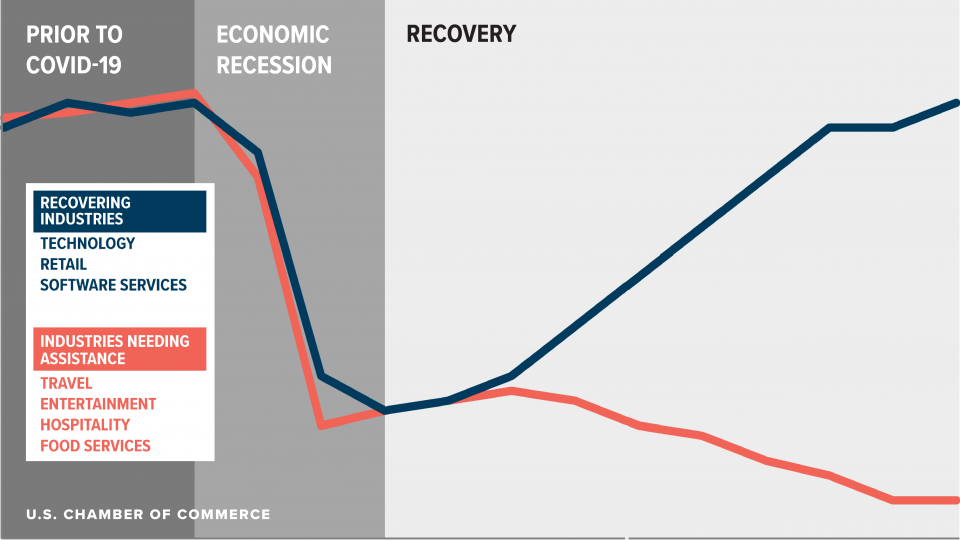
The image shows a graph depicting the number of businesses in the U.S. who have been affected by the COVID-19 pandemic, with the text indicating that the economy is recovering from the pandemic. The graph is divided into two sections, one for recovery and one for economic recovery, and each section is further divided into subsections, each representing a different industry. The text on the left side of the image provides further information about the data, such as the total number of companies affected and the total economic recovery.