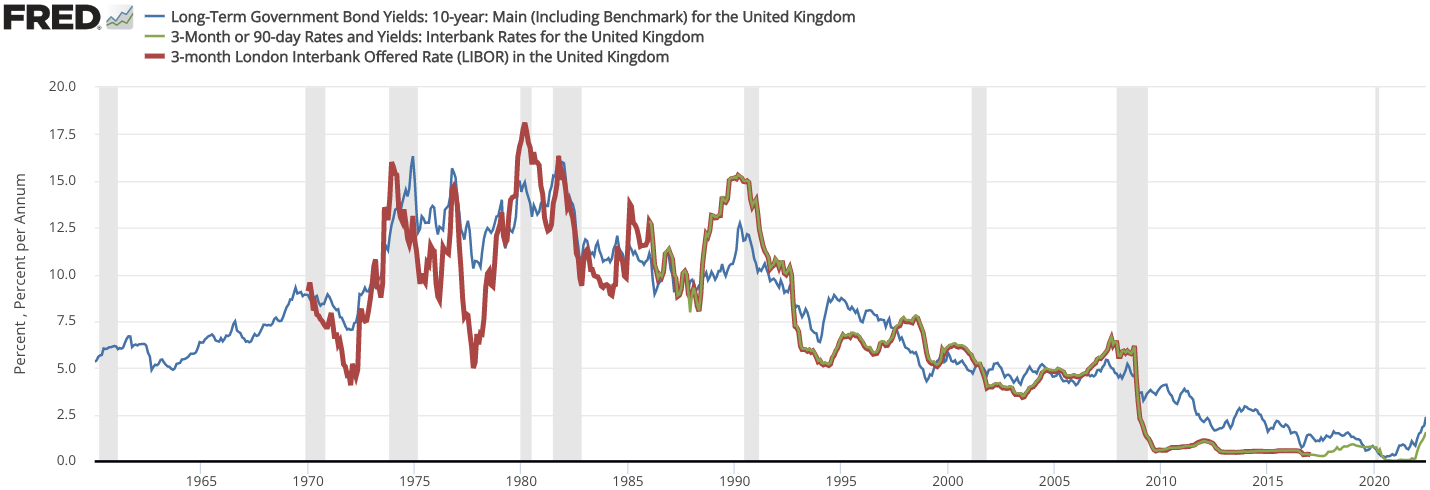
The image shows a graph depicting the long-term government bond yields in the United Kingdom.
Read full description
The image shows a graph depicting the long-term government bond yields in the United Kingdom. The graph is composed of different colored lines, each representing a different period of time, and the text on the graph provides further information about the bond yields.