Public domain photos
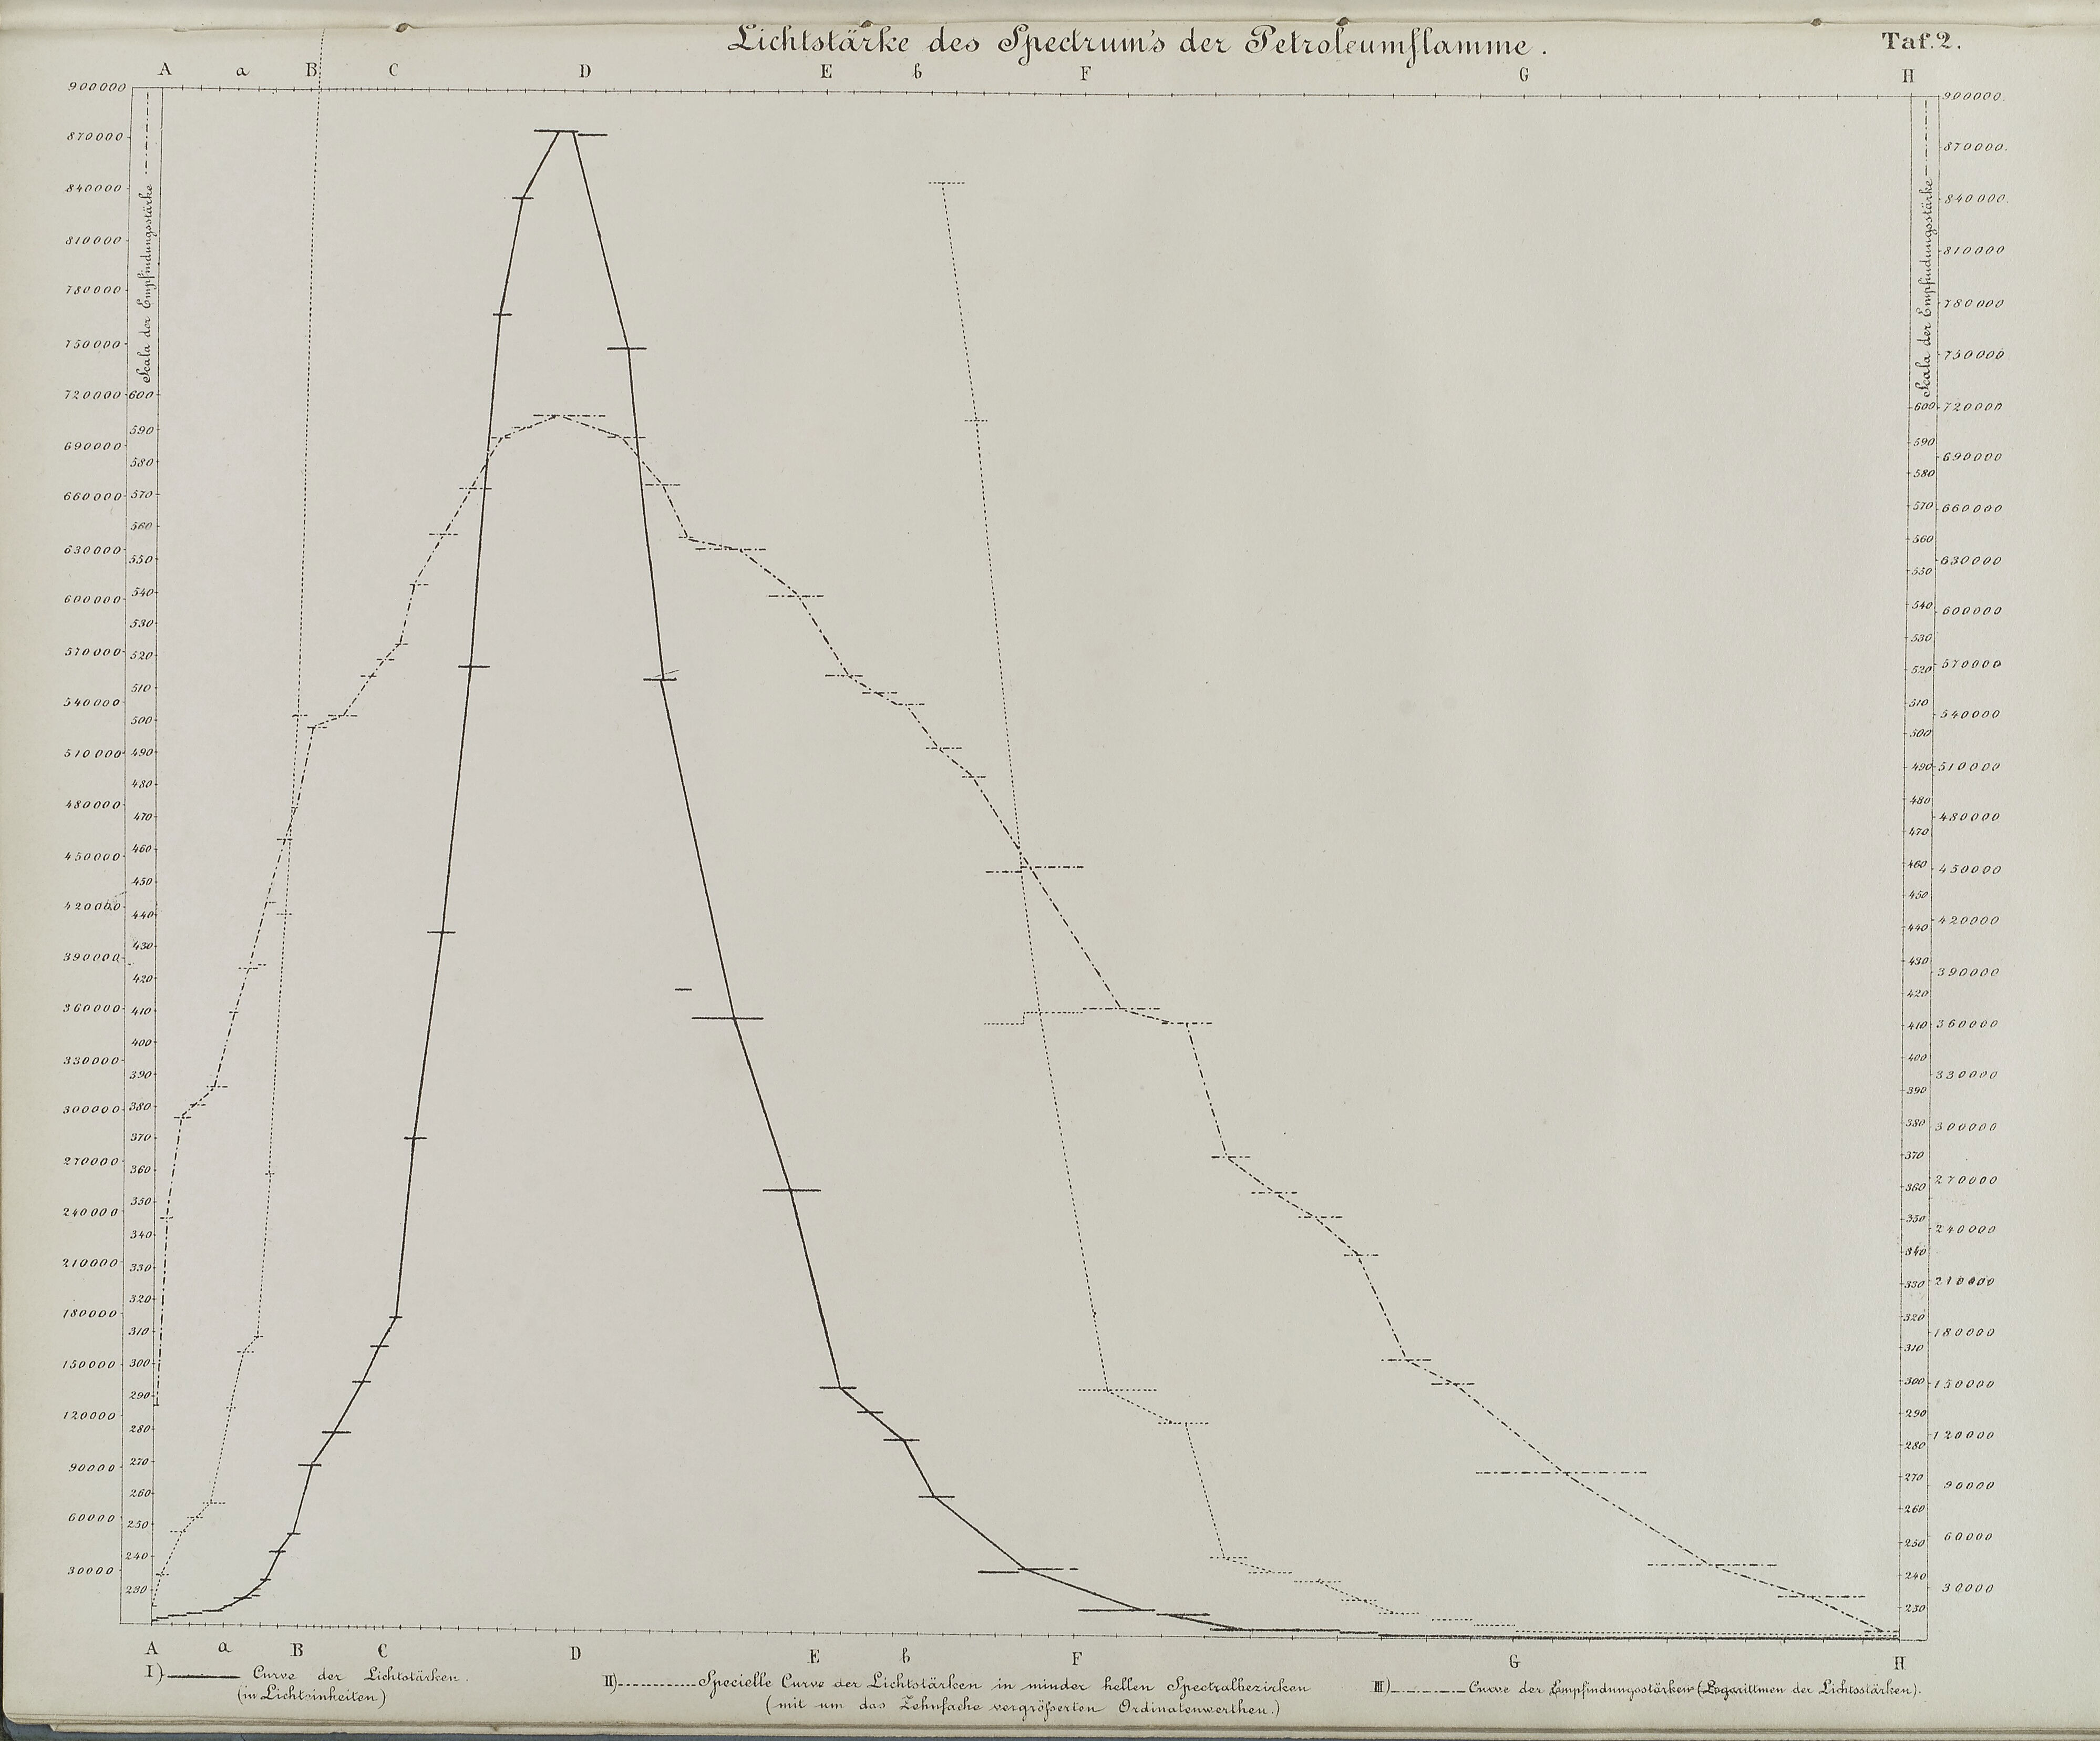
The image shows a graph on a piece of paper with a black background. The graph is composed of a series of points connected by a line, with the x-axis representing the time period and the y-axis indicating the number of people who have been diagnosed with cancer. The points on the graph are labeled with the names of the people affected by cancer, and the graph is accompanied by a legend that explains the meaning of each point.
 Open in library