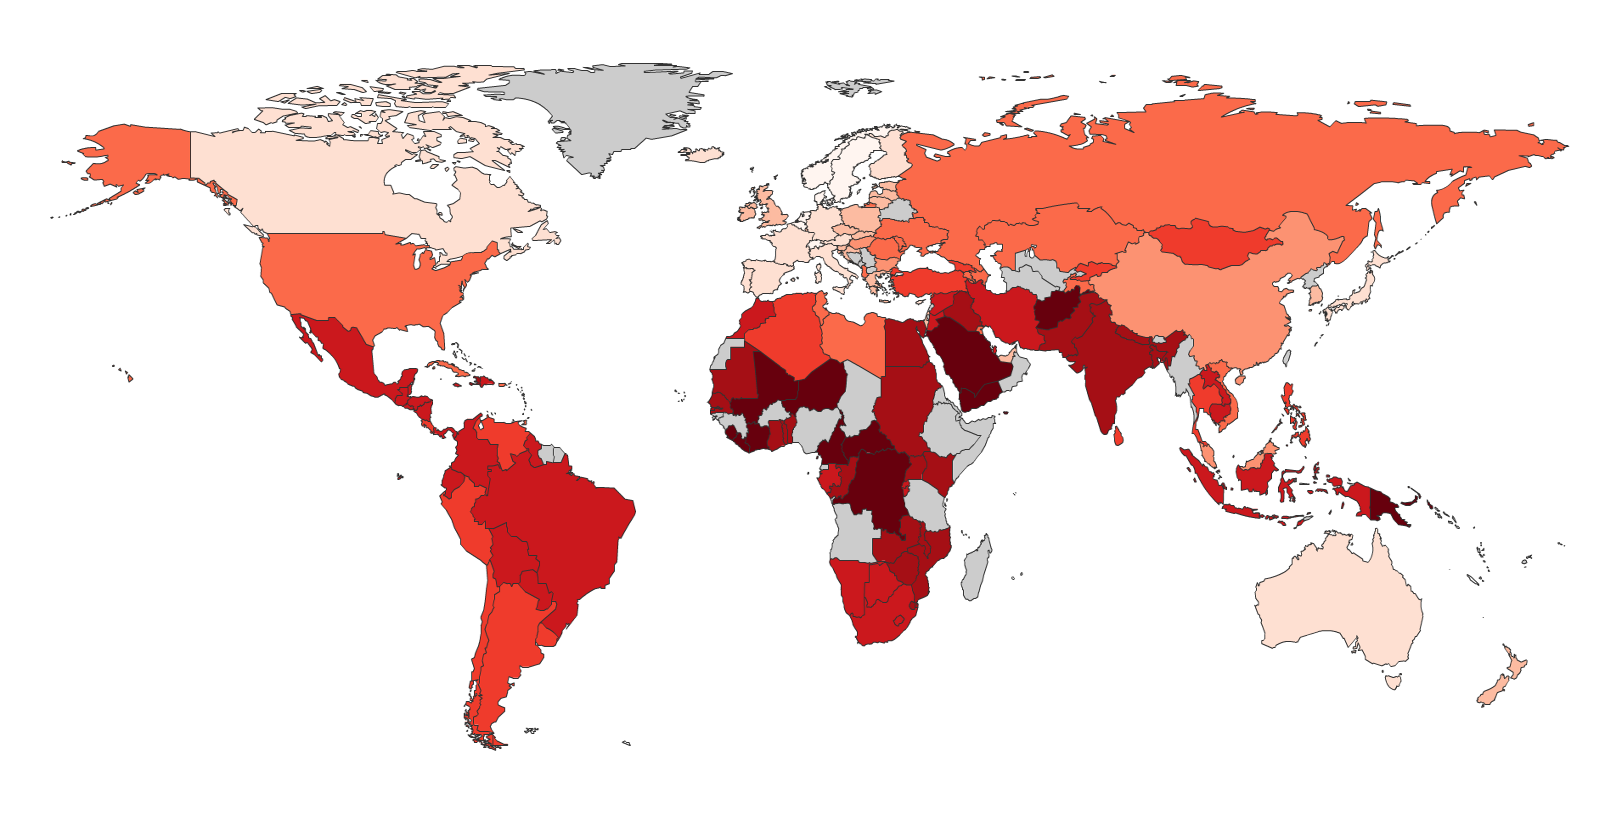
The image shows a map of the world with different colors representing the percentage of people living in each country.
Read full description
The image shows a map of the world with different colors representing the percentage of people living in each country. The colors range from light blue to dark blue, with darker blue indicating higher percentages. The map also shows the number of people who have lived in different countries, with the darker blue representing higher percentages and the lighter blue representing lower percentages.