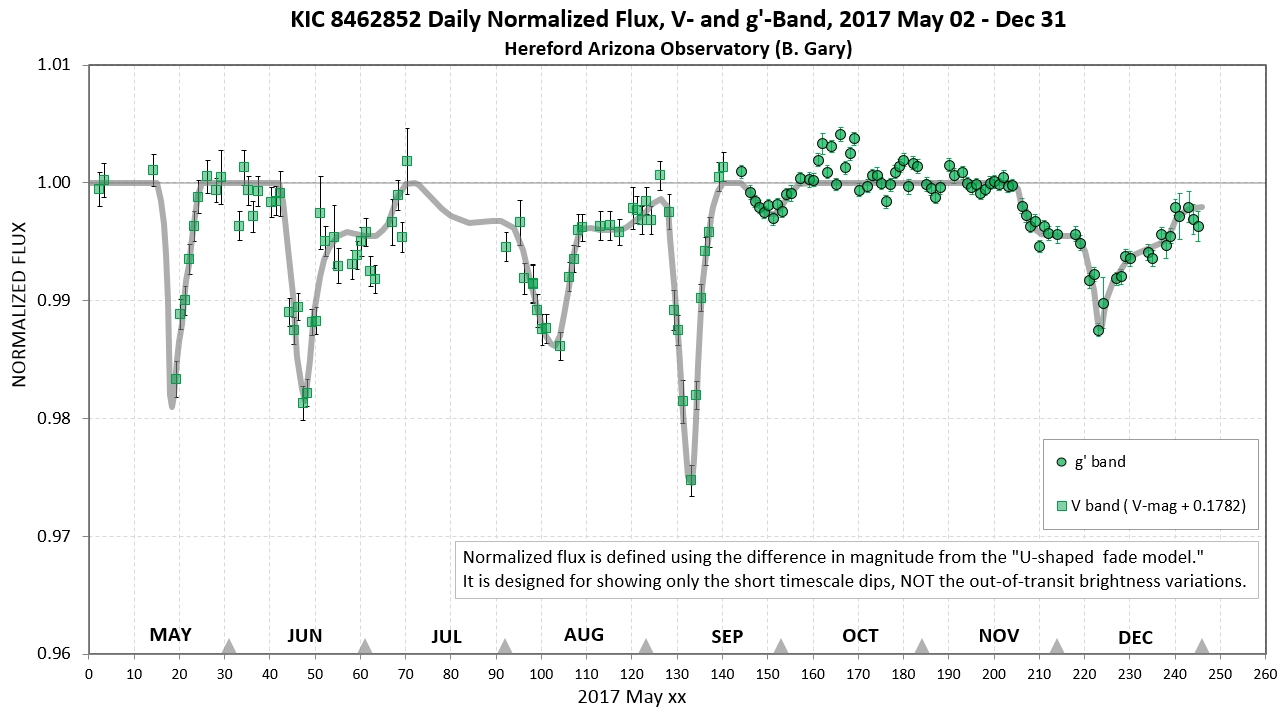
The image shows a graph on a white background with the text "KIC 8462852 Daily Normalized Flux, V-Band, 2017 May 02 - Dec 31" at the top.
Read full description
The image shows a graph on a white background with the text "KIC 8462852 Daily Normalized Flux, V-Band, 2017 May 02 - Dec 31" at the top. The graph displays the daily normalized flux of the KIC 8482852 band over the course of the month, with the x-axis representing the days of the week and the y-axis indicating the frequency of the flux.