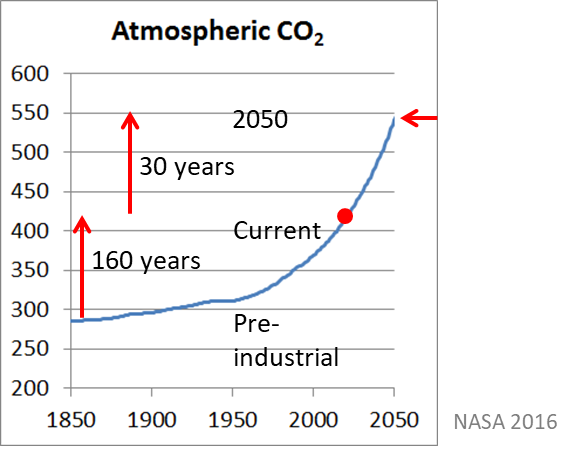
The image shows a graph of atmospheric CO2 emissions from the past decade, with text and numbers on a white background.
Read full description
The image shows a graph of atmospheric CO2 emissions from the past decade, with text and numbers on a white background. The graph displays the amount of CO2 in the atmosphere over a period of time, with the x-axis representing the years and the y-axis indicating the amount. The text on the white background provides further information about the graph, such as the source of the graph and the year it was released.