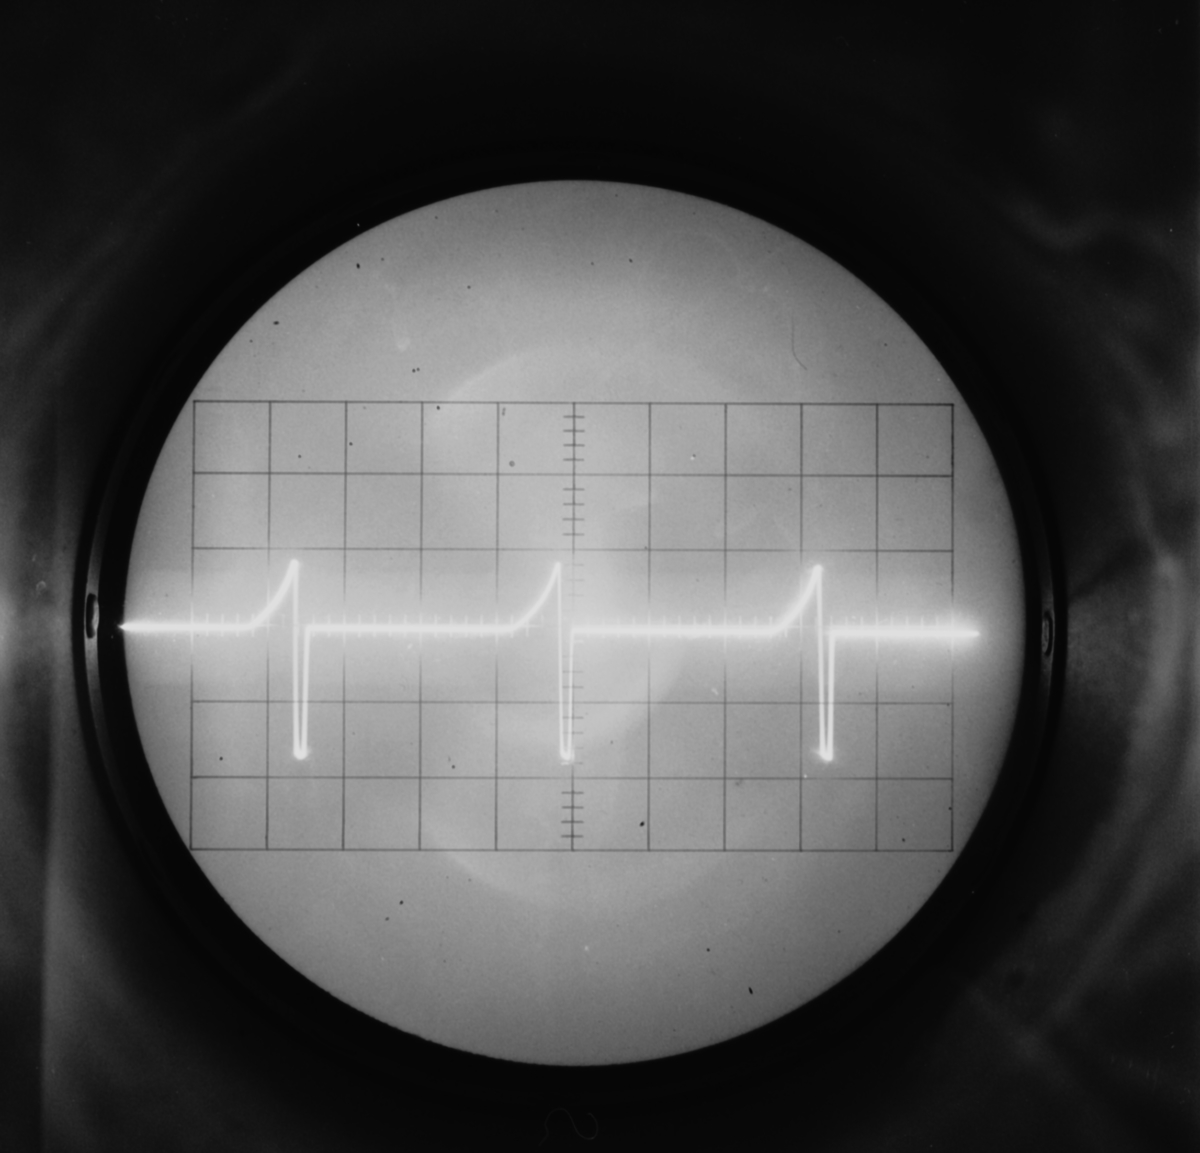
The image shows a black and white photo of an oscilloscope, with a graph in the center of the screen.
Read full description
The image shows a black and white photo of an oscilloscope, with a graph in the center of the screen. The graph is composed of a series of lines, each representing a different waveform. The lines are arranged in a radial pattern, with the x-axis representing the frequency of the waveform and the y-axis indicating the amplitude of the oscilloscope.