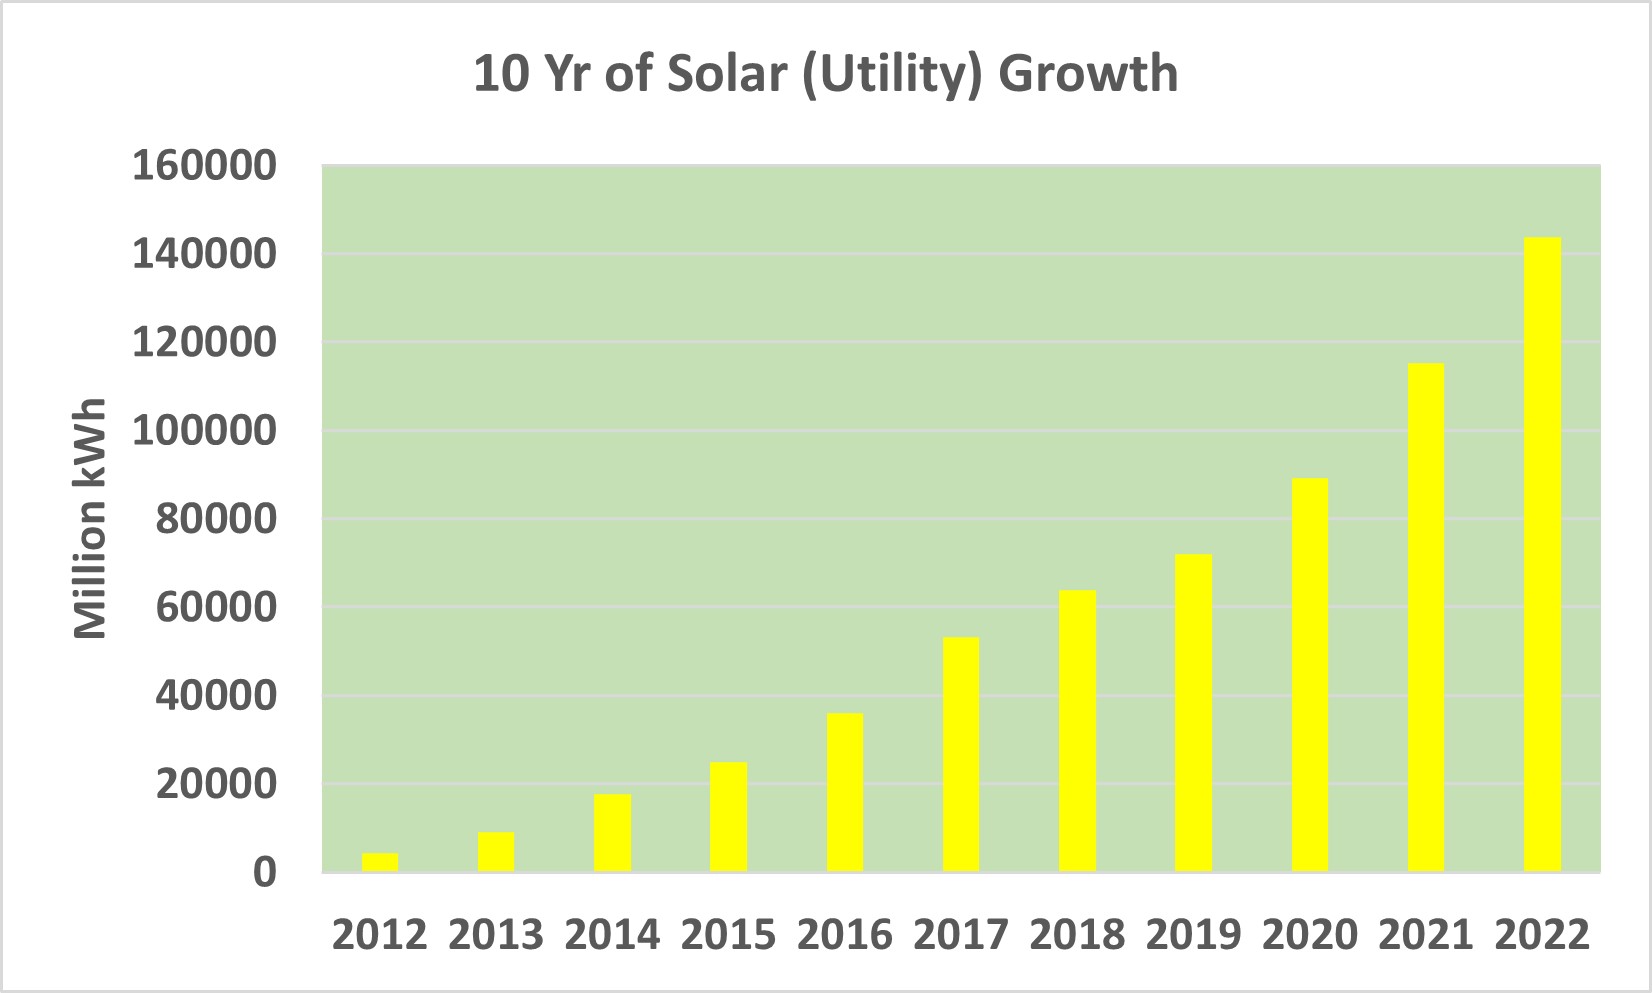
The image shows a graph depicting the 10 year of solar utility growth.
Read full description
The image shows a graph depicting the 10 year of solar utility growth. The graph is composed of a series of bars, each representing a year, with the height of each bar indicating the amount of solar energy generated. The text at the top of the image reads "10 Year of Solar Utility Growth".