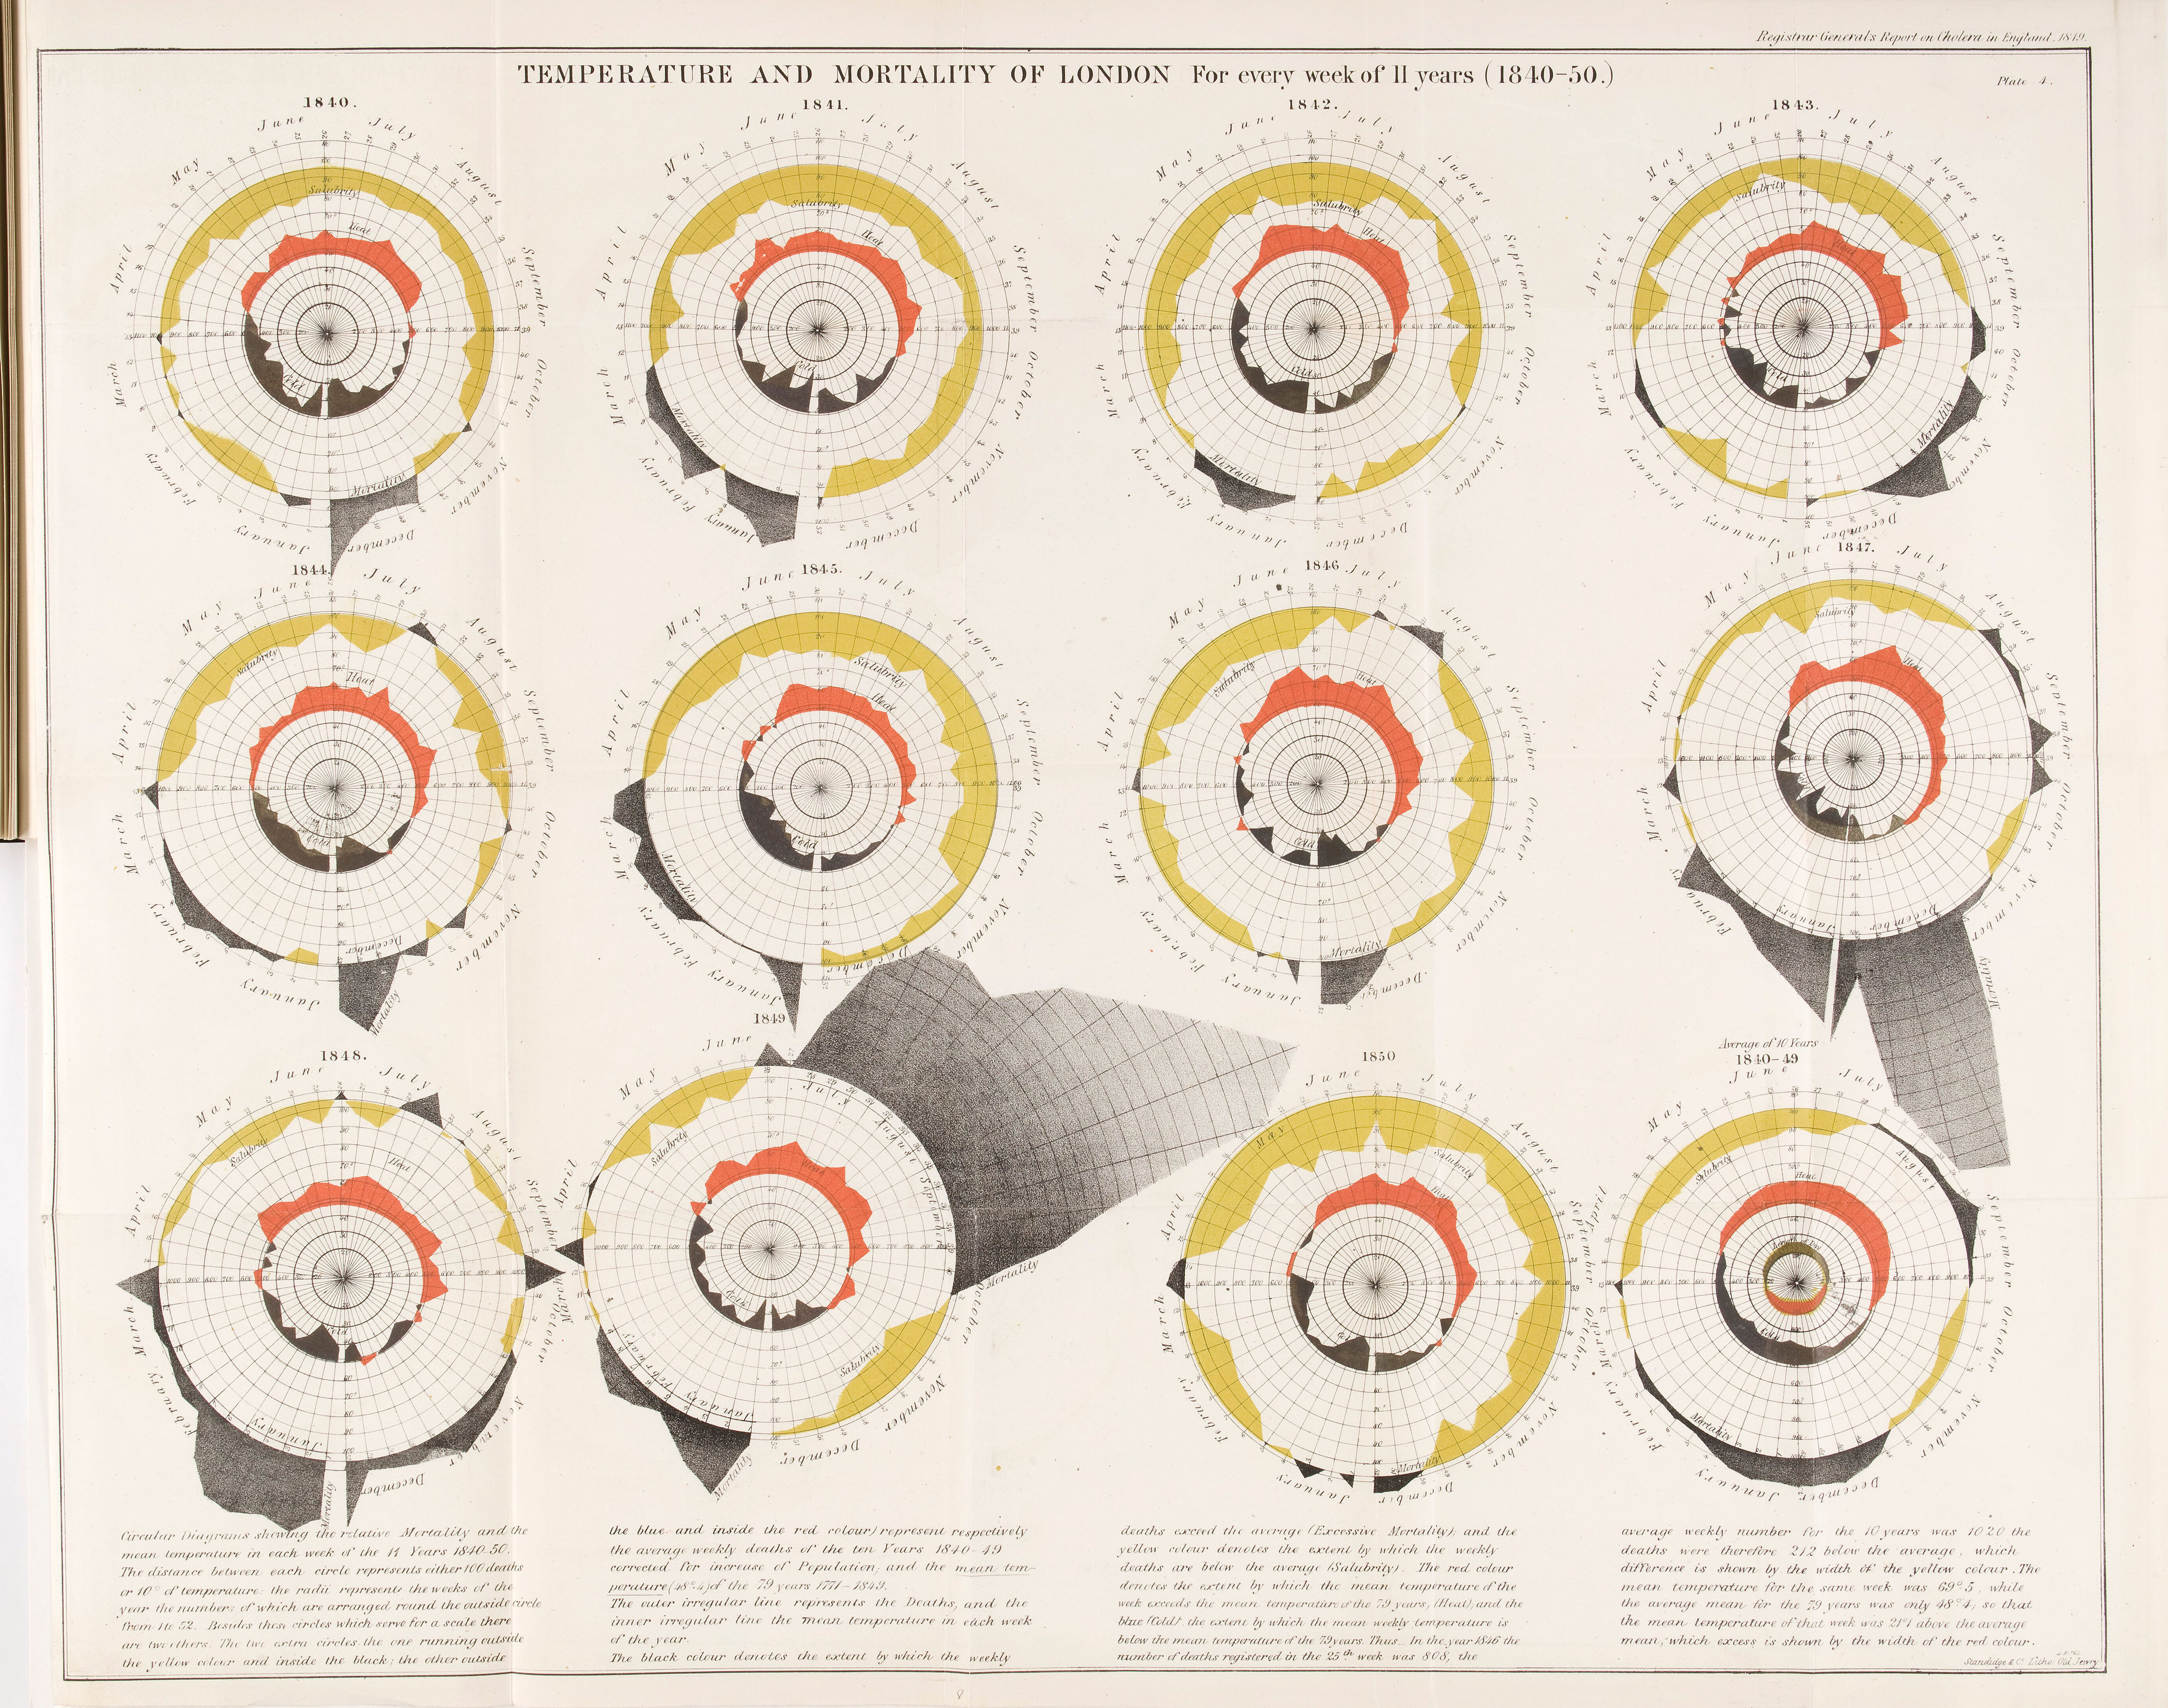
The image shows an open book with a diagram on it, depicting the temperature and mortality of London for every week of 1810-50.
Read full description
The image shows an open book with a diagram on it, depicting the temperature and mortality of London for every week of 1810-50. The diagram is composed of several circles, each with a different color, and text written on it.