Public domain photos
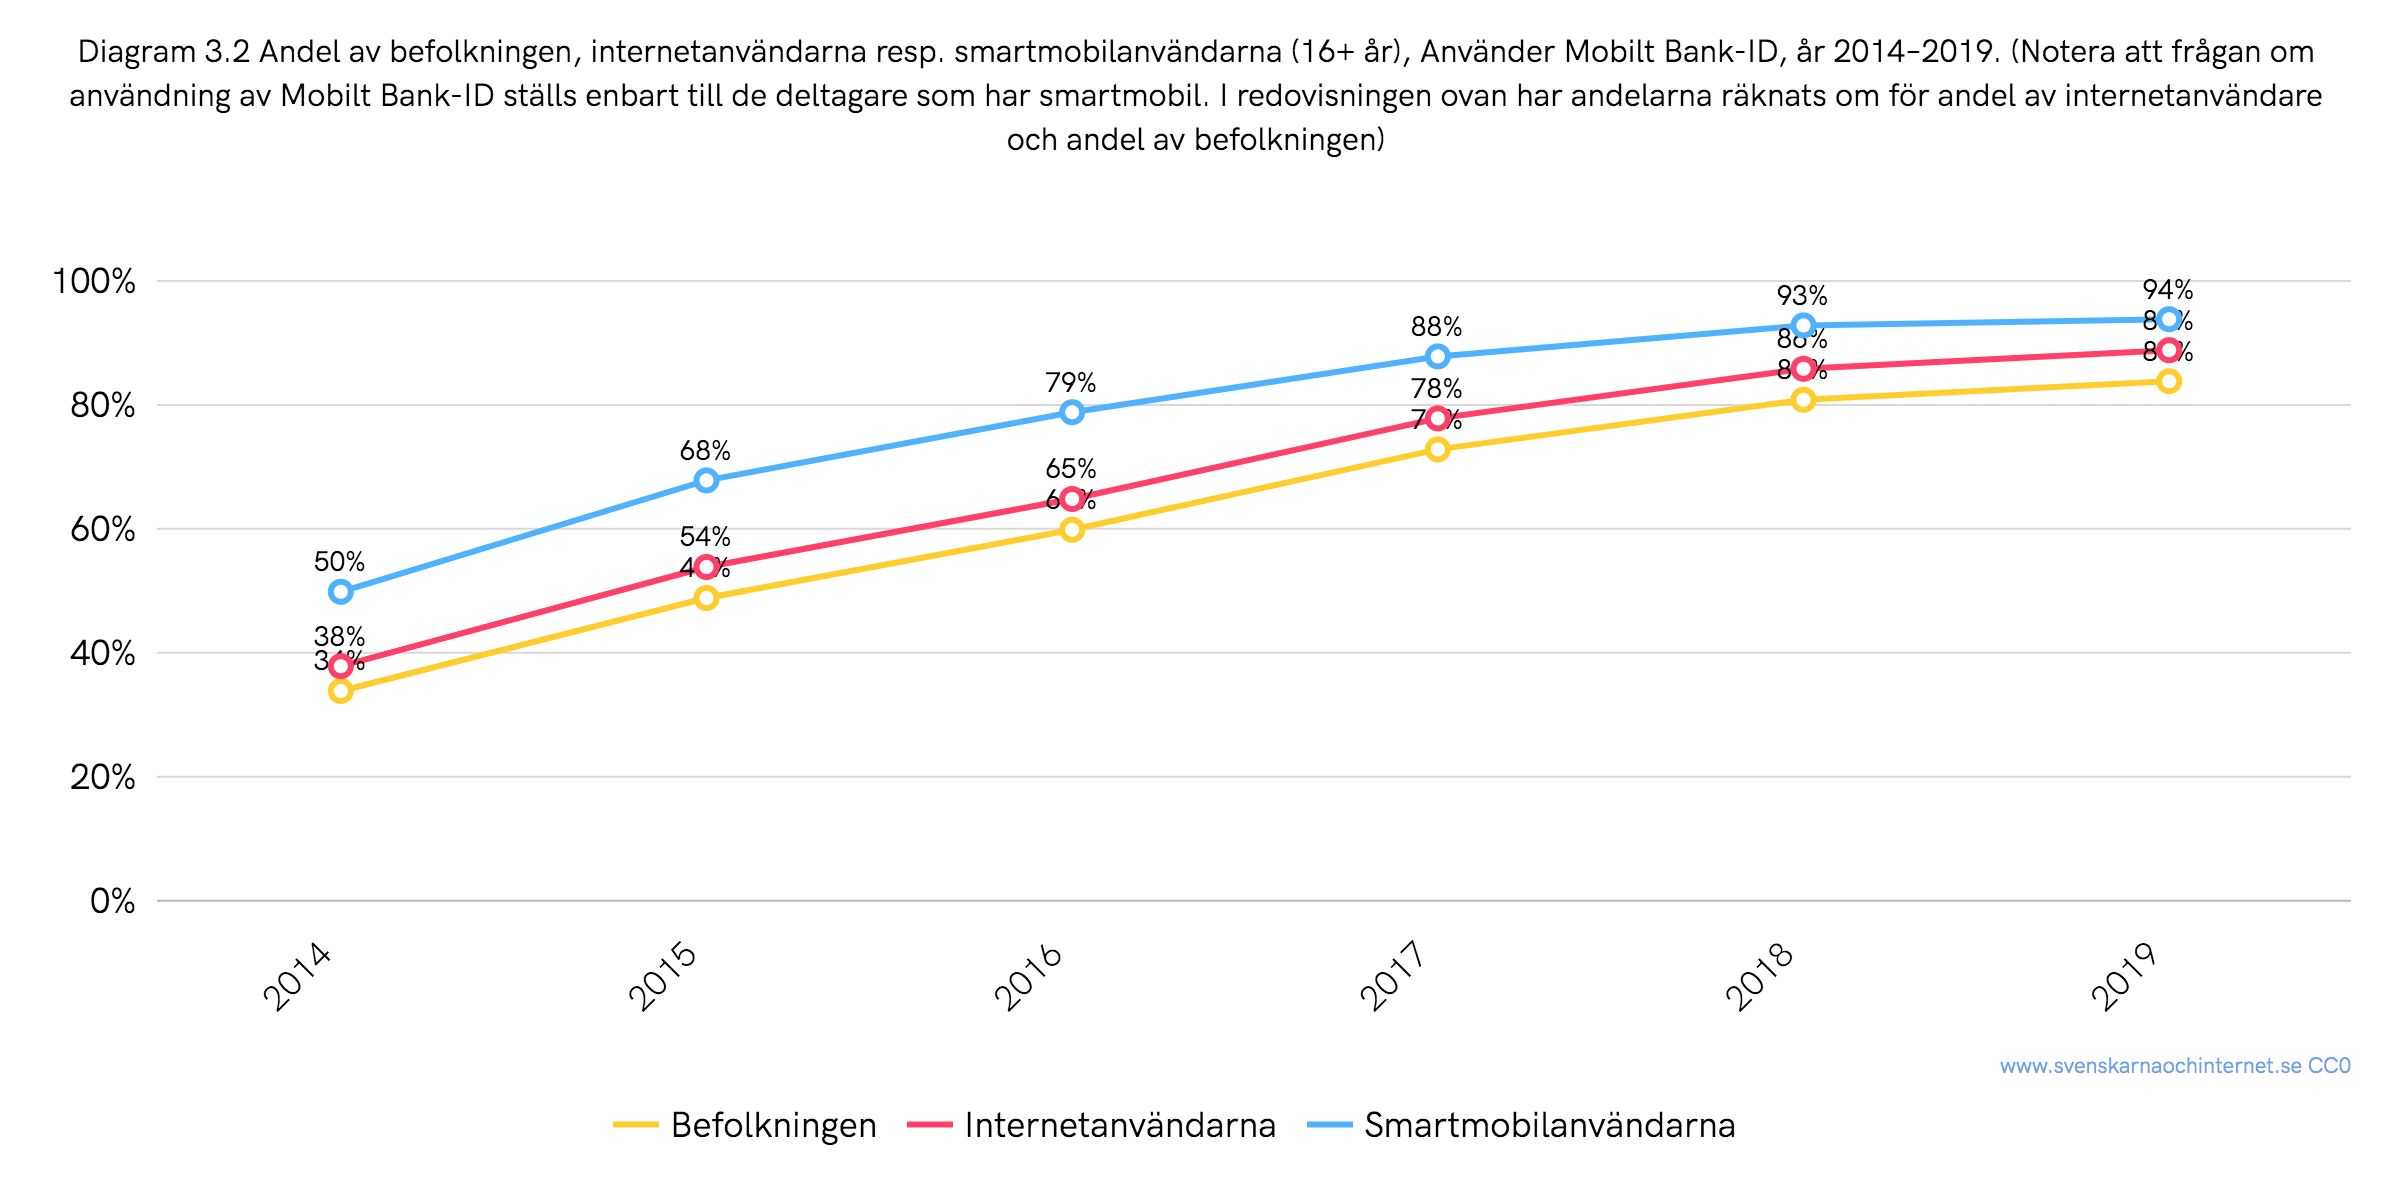
The image shows a line graph depicting the number of people who have been diagnosed with cancer in Sweden. The graph is divided into four sections, each representing a different year, and each section is further divided into percentages. The text accompanying the graph provides further information about the data.
 Open in library