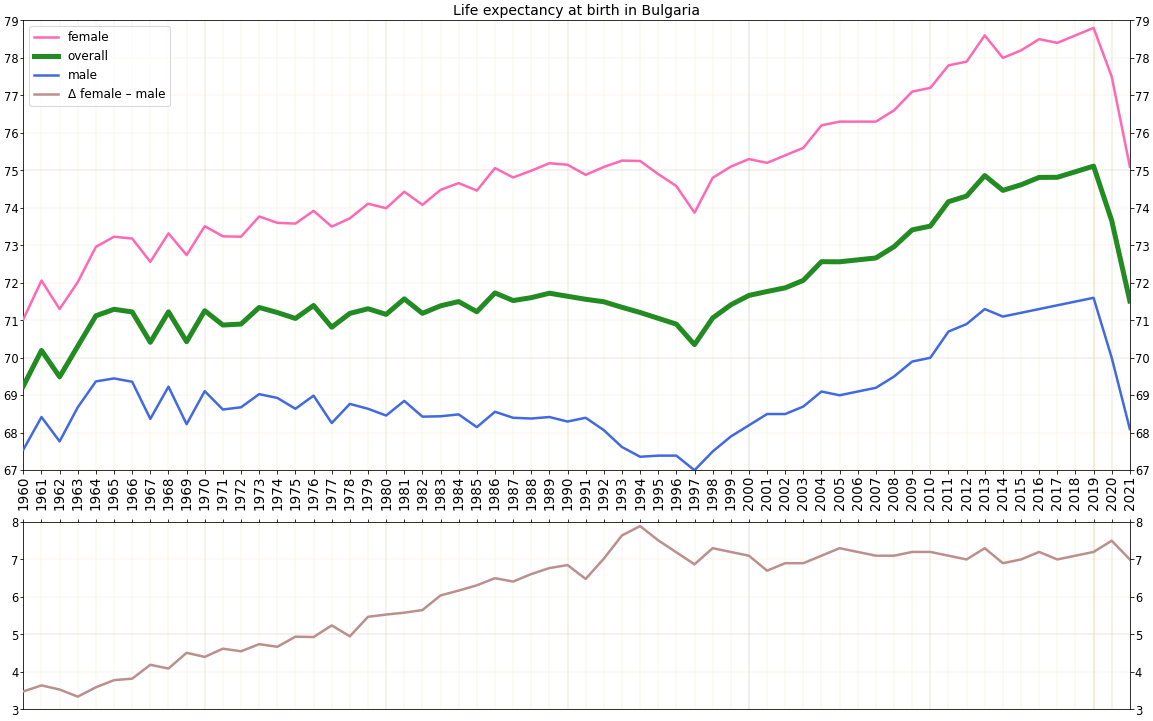
The image shows a line graph depicting the life expectancy at birth in Bulgaria.
Read full description
The image shows a line graph depicting the life expectancy at birth in Bulgaria. The graph is composed of different colored lines, each representing a different age group, and the height of each line indicates the number of people living in that age group. The text on the graph provides further information about the data, such as the age range, gender, and other relevant information.