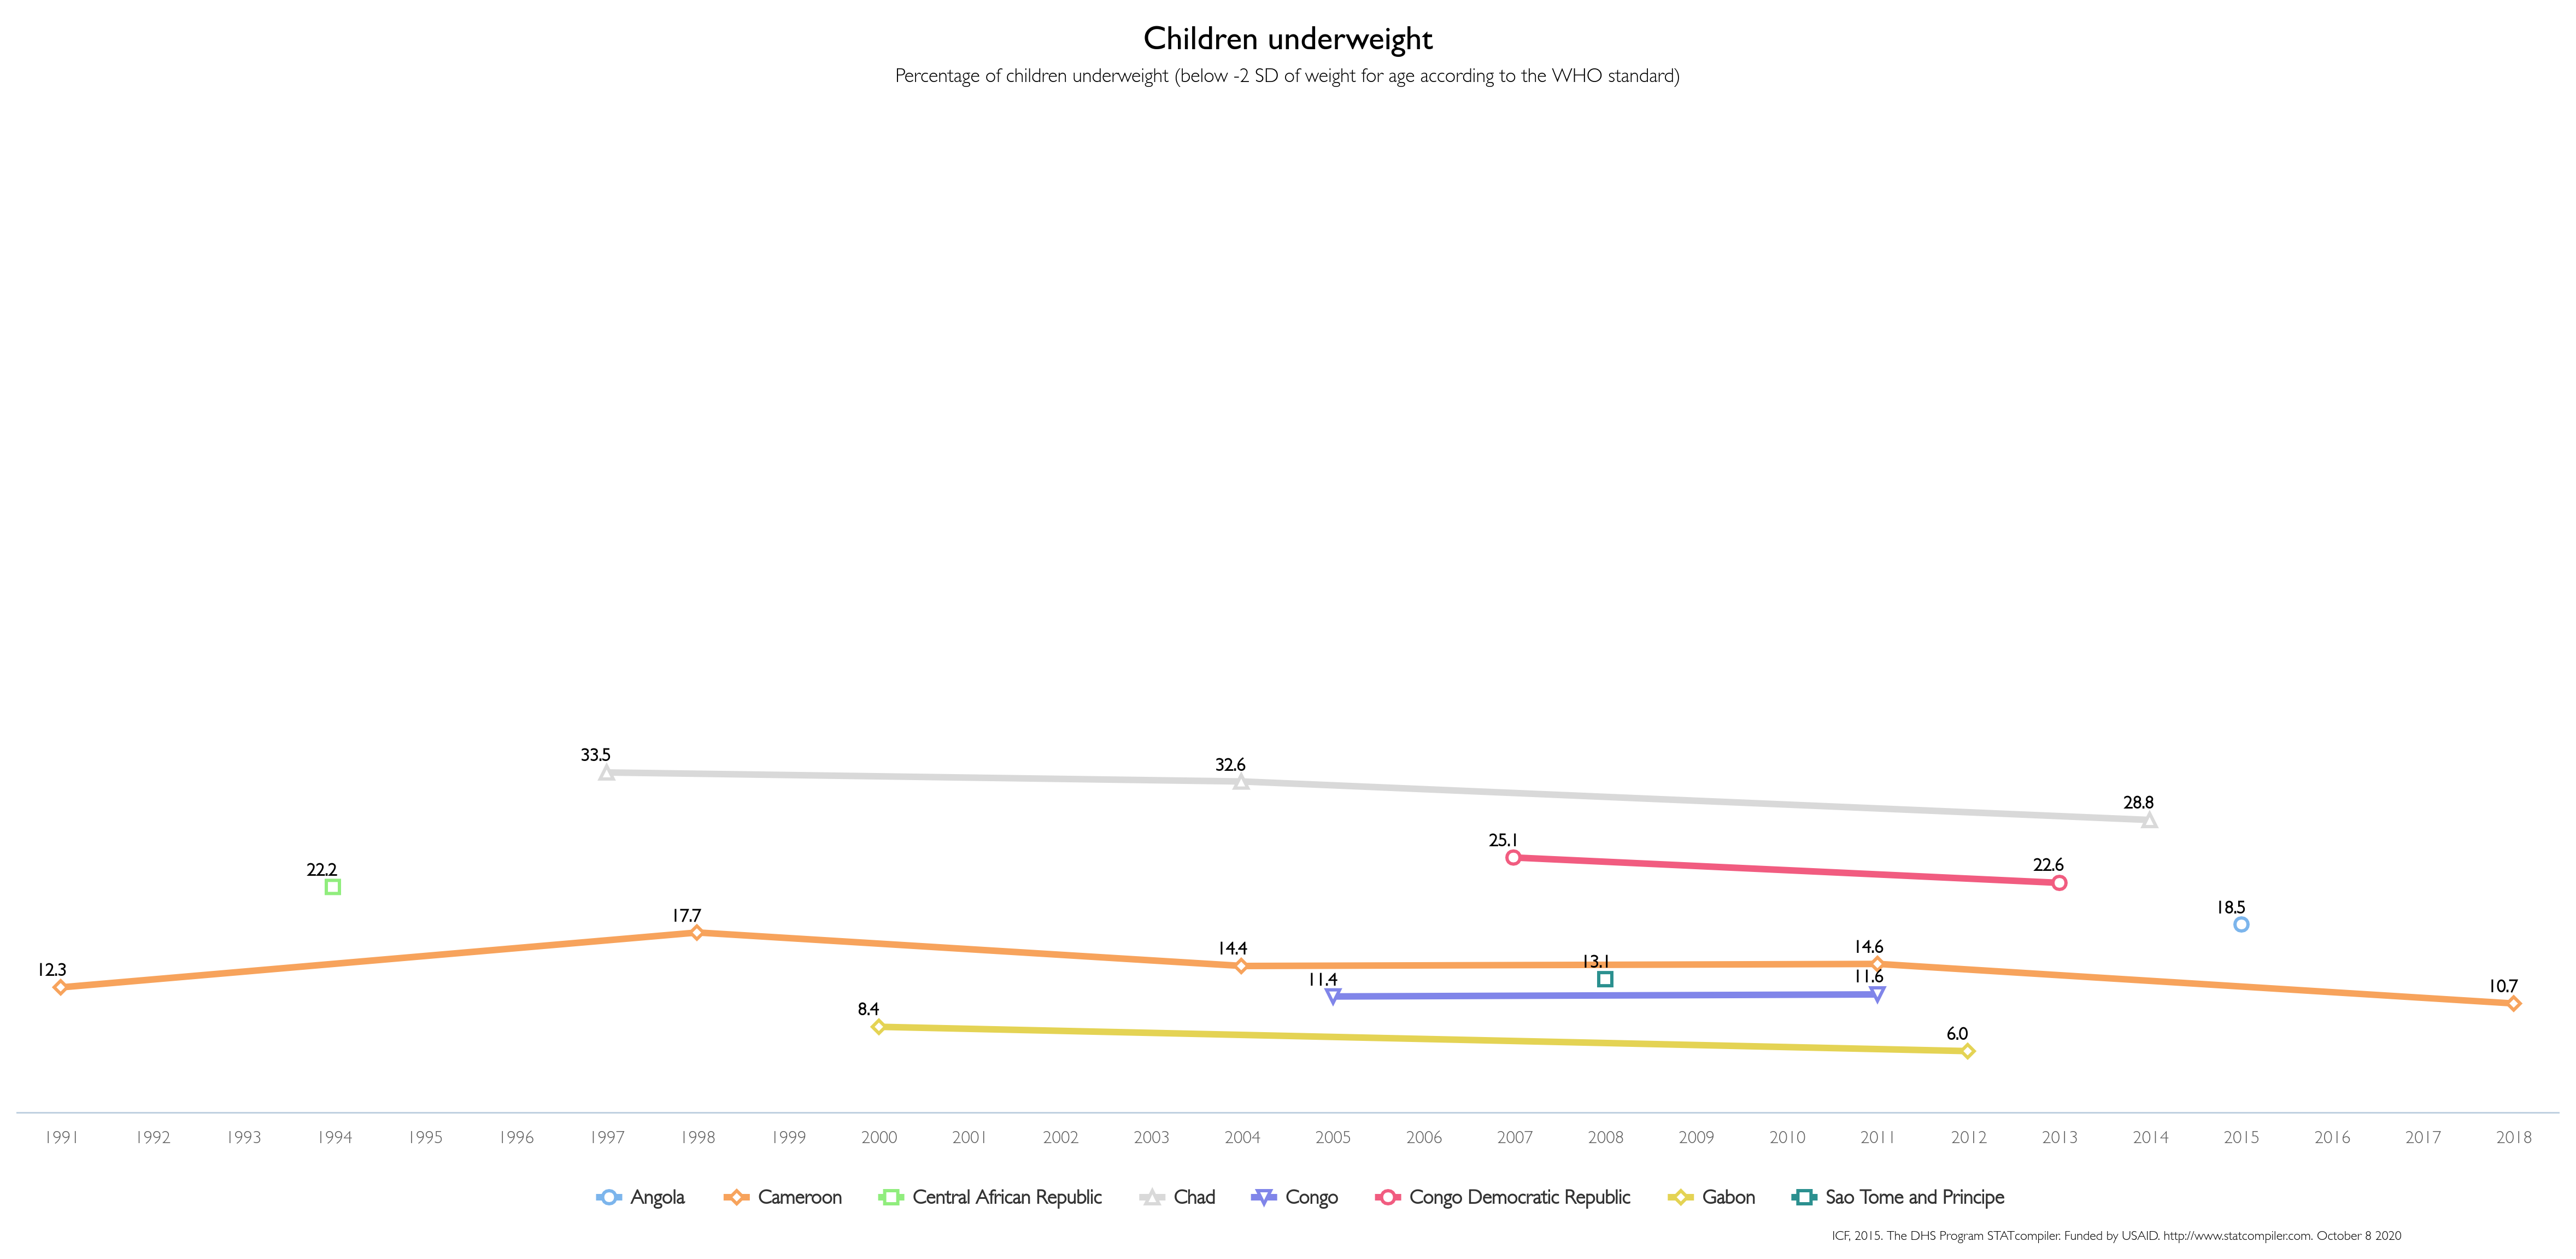
The image shows a line graph depicting the percentage of children underweight in the United States.
Read full description
The image shows a line graph depicting the percentage of children underweight in the United States. The graph is composed of different colored lines, each representing a different age group, and the height of each line indicates the percentage. The background of the graph is white, and there is text at the top and bottom of the image.