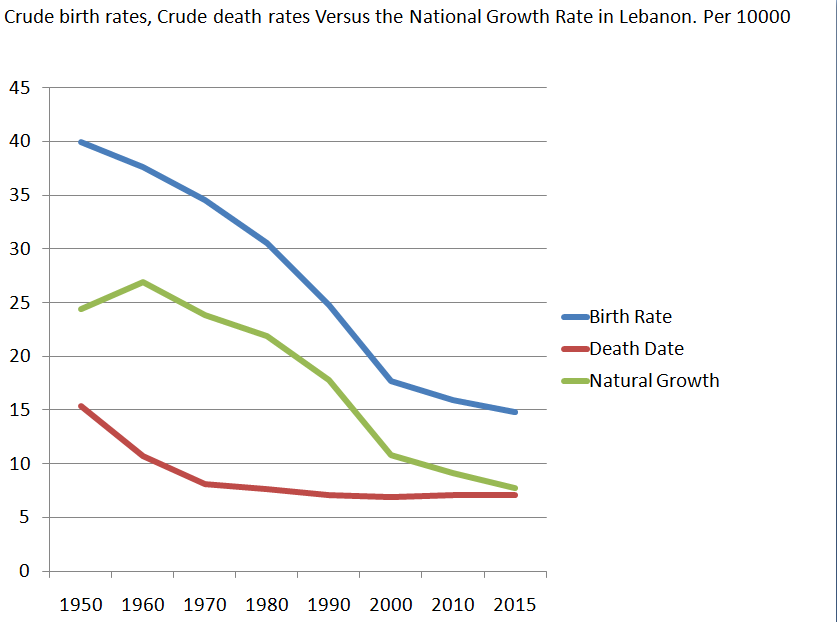
The image shows a graph on a white background with text that reads "Crude Birth Rates, Crude Death Rates Versus the National Growth Rate in Lebanon".
Read full description
The image shows a graph on a white background with text that reads "Crude Birth Rates, Crude Death Rates Versus the National Growth Rate in Lebanon". The graph is divided into two sections, one for crude birth rates and one for natural growth rate in Lebanon. The x-axis of the graph is labeled with the years from 1950 to 2015, while the y-axis is labeled as the national growth rate. The graph shows a steady increase in the number of deaths in Lebanon over the years.