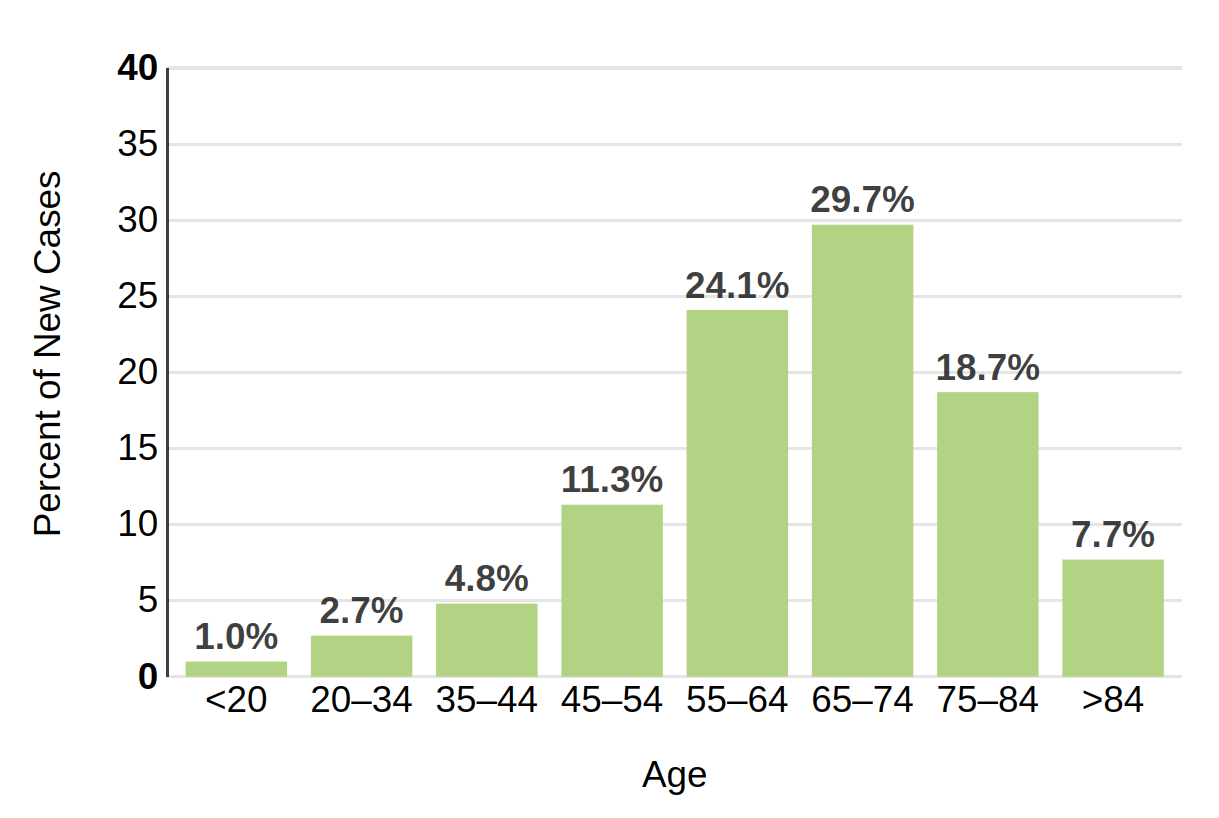
The image shows a bar chart depicting the percentage of new cases of coronavirus in the United States.
Read full description
The image shows a bar chart depicting the percentage of new cases of coronavirus in the United States. The chart is divided into sections, each representing a different age group, and the height of each section indicates the number of cases.