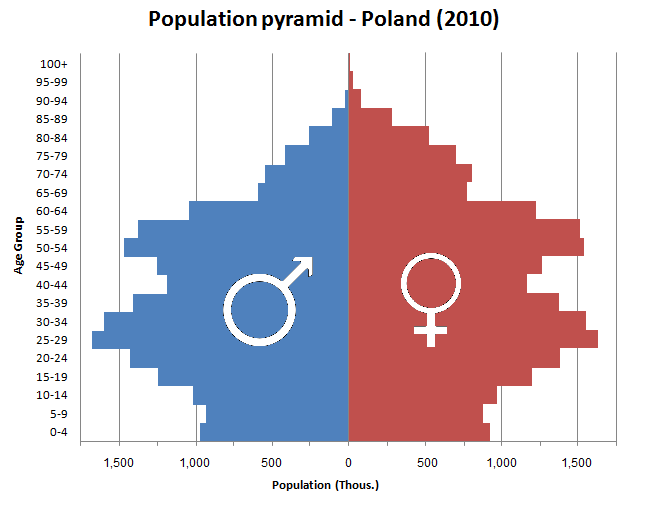
The image shows a graph depicting the population pyramid in Poland from 2010.
Read full description
The image shows a graph depicting the population pyramid in Poland from 2010. The graph is divided into two sections, one in blue and one in red, and each section is further divided into percentages. The text at the top of the image reads "Poland Population Pyramid 2010".