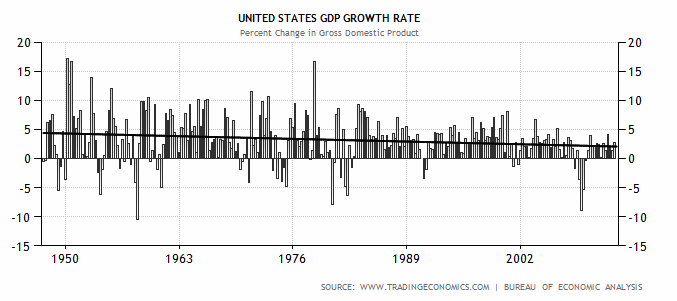
The image shows a graph of the United States GDP growth rate from 1950 to 2012.
Read full description
The image shows a graph of the United States GDP growth rate from 1950 to 2012. The graph is composed of a series of bars, each representing a different year, with the height of each bar indicating the growth rate. The x-axis of the graph is labeled with the years, while the y-axis is labeled as the GDP rate.