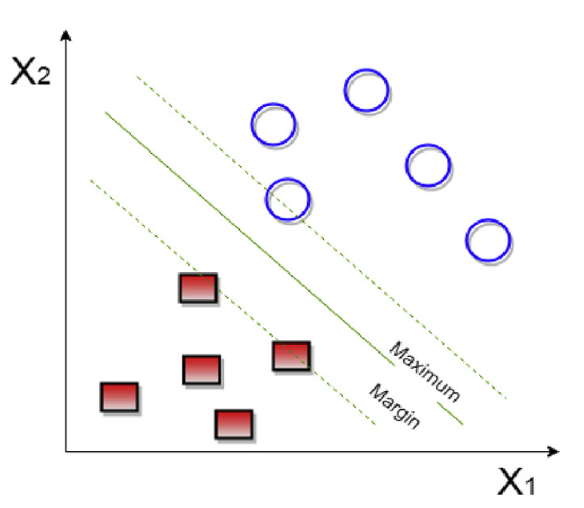
The image shows a scatter plot with a line plotted to the left and a line graph to the right.
Read full description
The image shows a scatter plot with a line plotted to the left and a line graph to the right. The background is white and the plot consists of red, blue, and green color boxes, as well as some text. The x-axis of the plot is labeled "x2" and the y-axis is labeled as "x1".