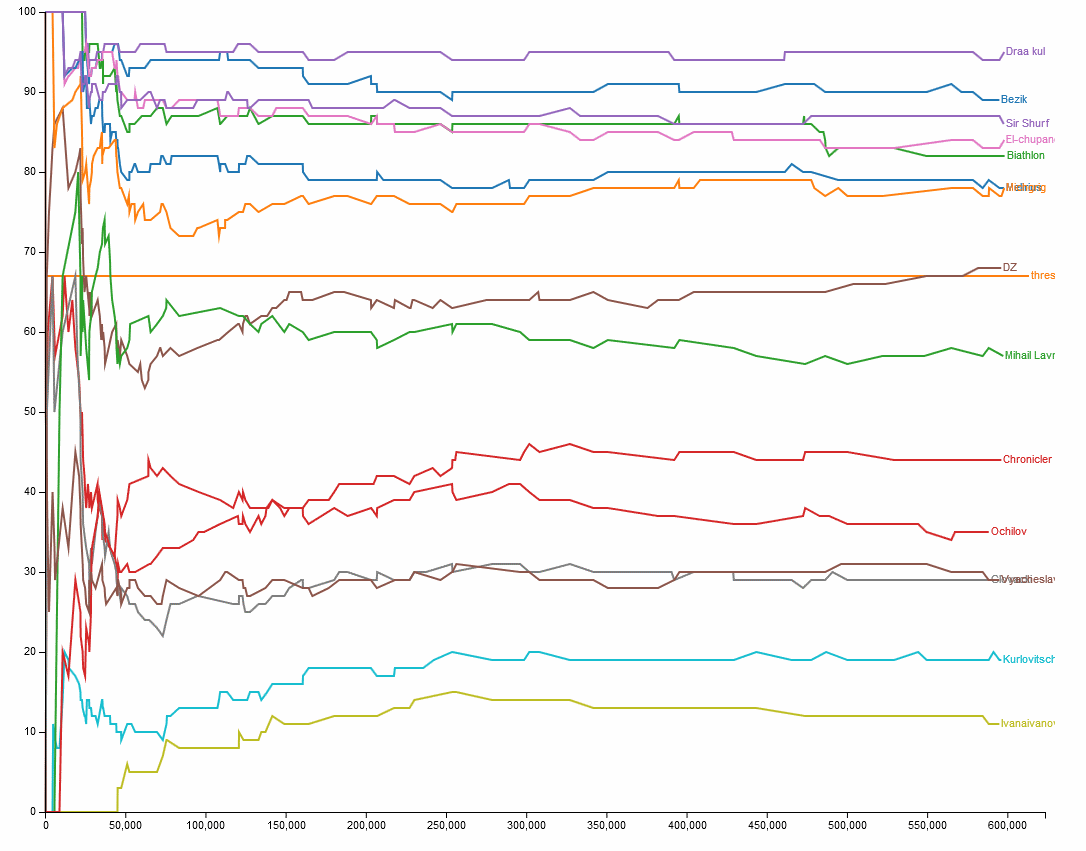
The image shows a graph on a white background with different colored lines representing the number of people who have died in a car accident.
Read full description
The image shows a graph on a white background with different colored lines representing the number of people who have died in a car accident. The graph is composed of different colors, each representing a different year, and the text on the screen provides further information about the data.