Read full description
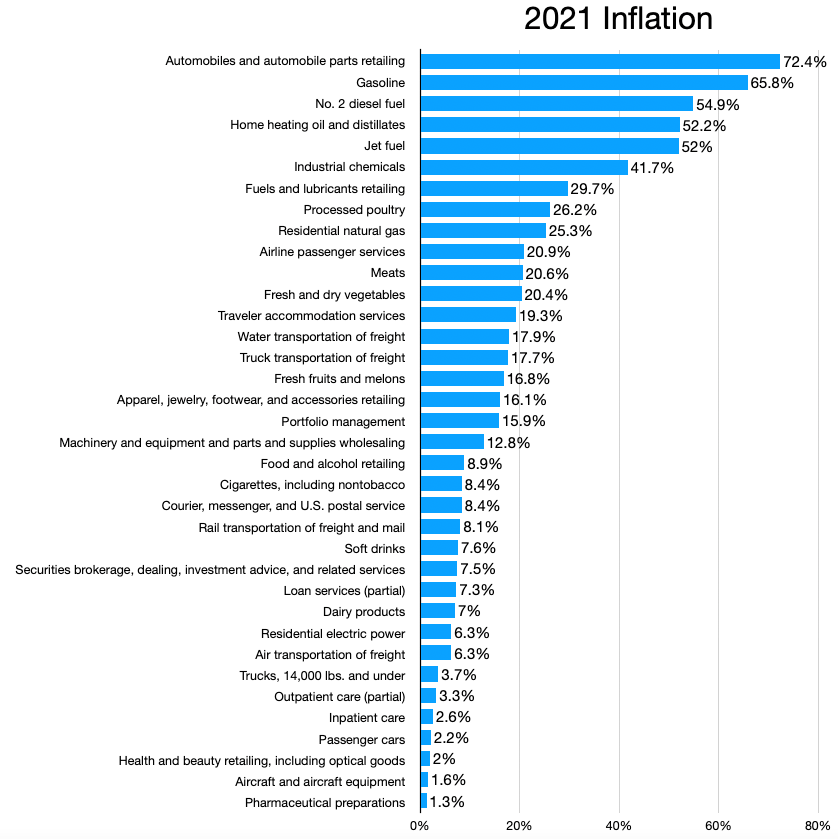
The image shows a bar chart depicting the number of people who have been diagnosed with cancer in the United States in 2021, with the text "Inflation" at the top. The chart is divided into sections, each representing a different year, and each section is further divided into percentages, indicating the amount of inflation in that year.