Public domain photos
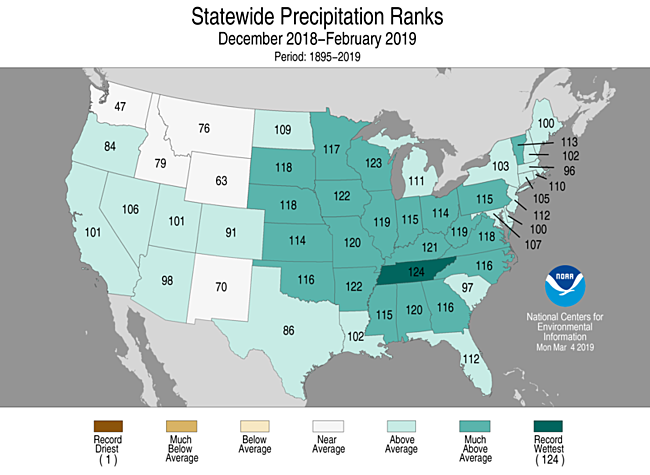
The image shows a map of the United States with the statewide precipitation ranks for December 2018-February 2019. The map is divided into different colors, each representing a different state, and the text at the top and bottom of the image provides additional information about the data.
 Open in library