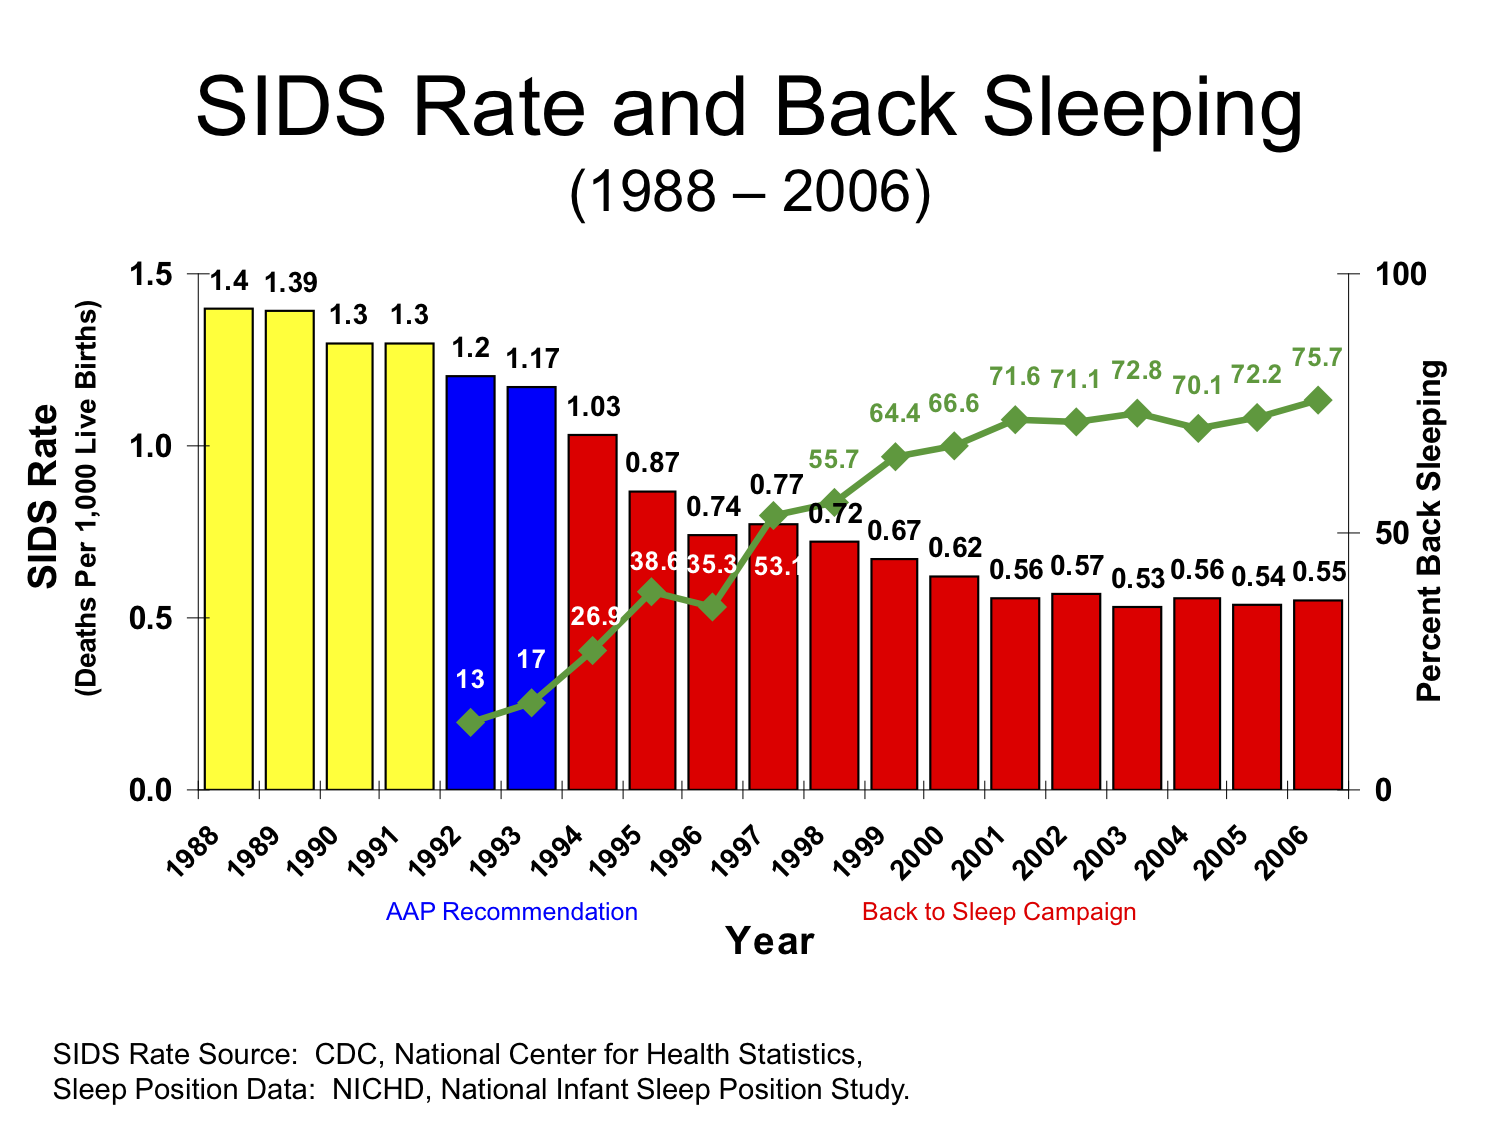
The image shows a graph depicting the SIDS rate and back sleeping from 1988 to 2006.
Read full description
The image shows a graph depicting the SIDS rate and back sleeping from 1988 to 2006. The graph is composed of several bars of varying heights, each representing a different year, with the height of each bar indicating the rate of sleep. The text accompanying the graph provides further information about the data.