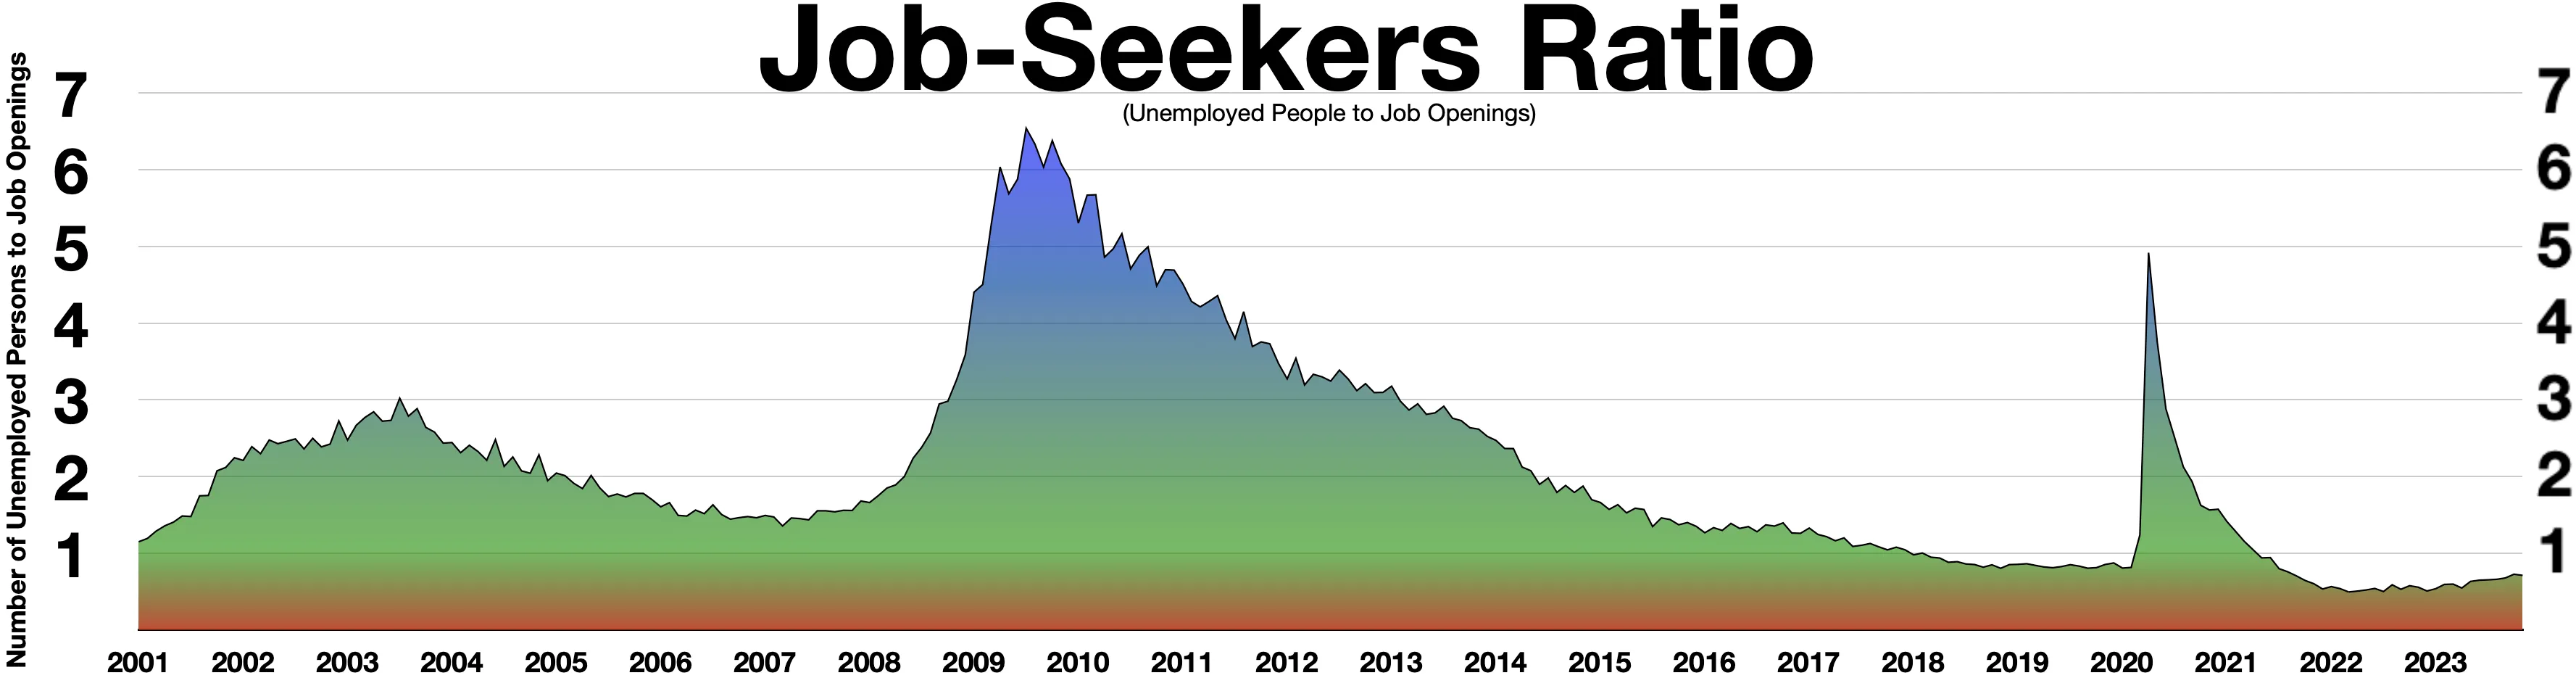
The image shows a graph with different colors representing the job seekers ratio.
Read full description
The image shows a graph with different colors representing the job seekers ratio. The text at the top of the image reads "Job Seekers Ratio". The graph is composed of a series of bars, each representing a different job seeker's ratio, with the height of each bar indicating the number of job seekers in each category. The colors of the bars range from light blue to dark blue, with darker blue indicating higher job seekers. The graph also includes a legend at the bottom that explains the meaning of the colors.