Read full description
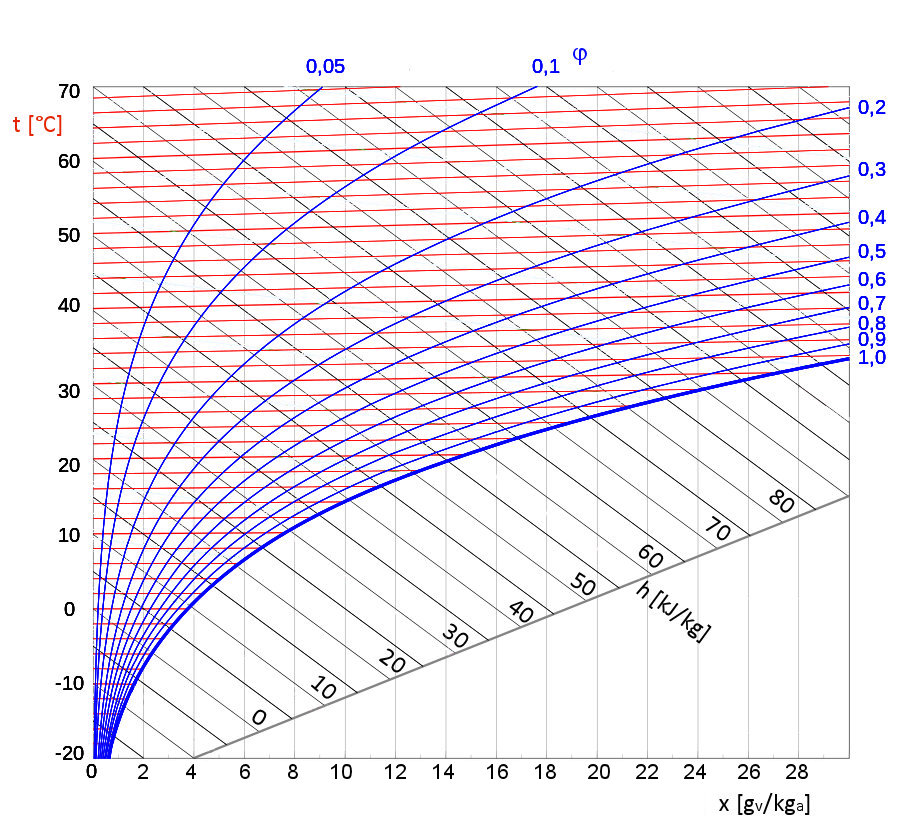
The image shows a plot of the temperature and pressure of a single-phase reactor, with the x-axis representing the temperature of the reactor and the y-axis indicating the pressure of the liquid. The plot is displayed on a computer screen, with text at the top and bottom of the image.