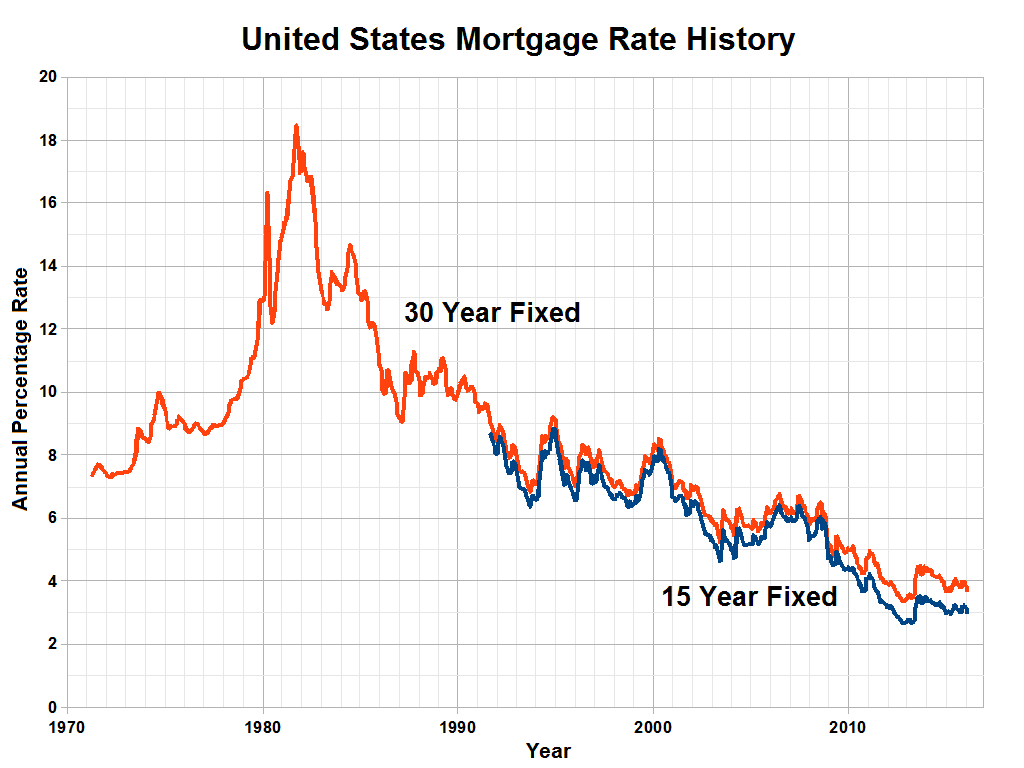
The image shows a graph on a white background with text that reads "United States Mortgage Rate History".
Read full description
The image shows a graph on a white background with text that reads "United States Mortgage Rate History". The graph is composed of two lines, one in blue and one in red, that represent the mortgage rate history. The blue line is steadily increasing, indicating a steady increase in mortgage rates over time. The red line is slightly lower than the blue line, indicating an increase in the rate. The text is written in a bold font and is centered on the graph.