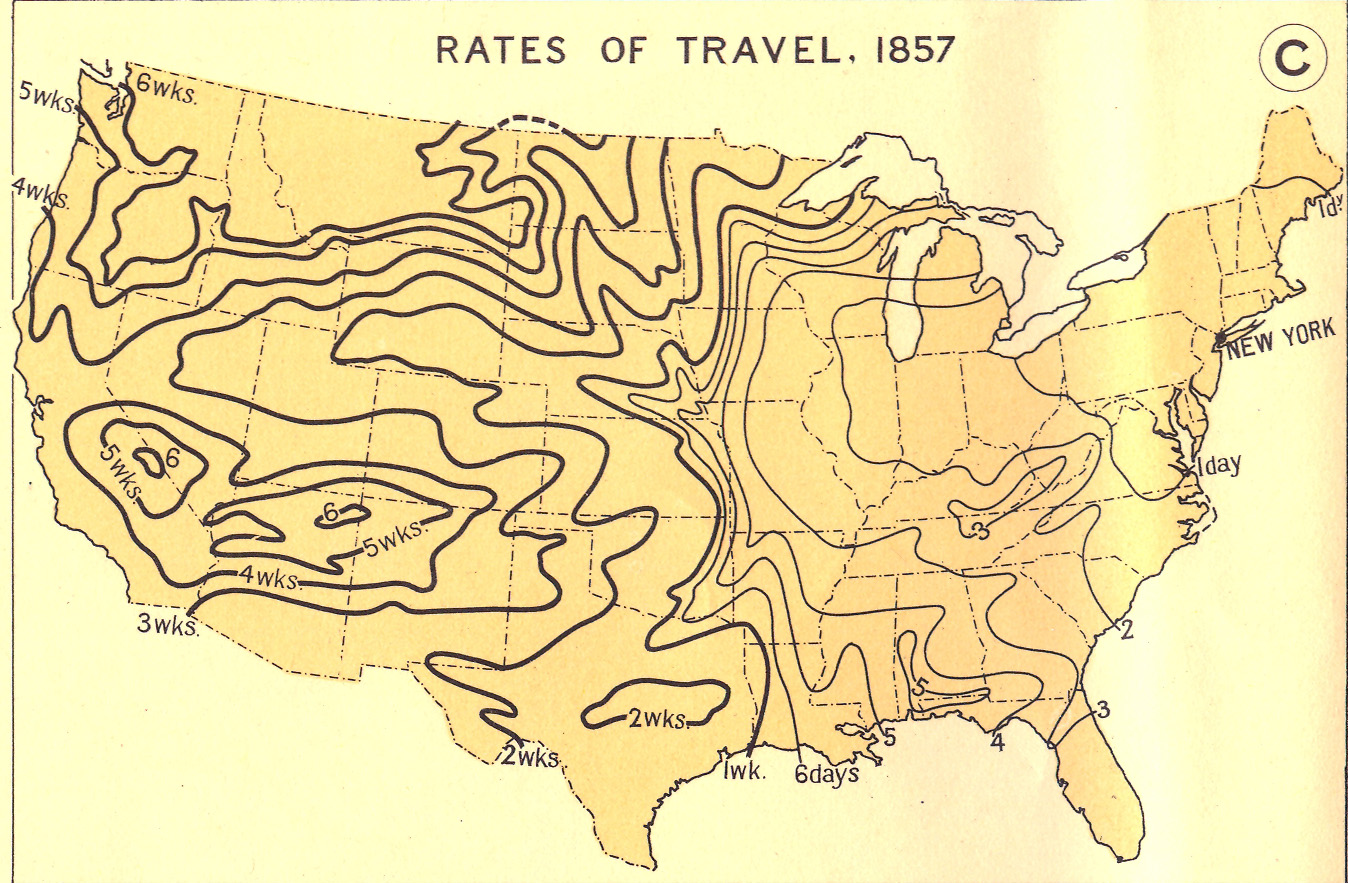
The image shows a map of the United States with the rates of travel from 1857.
Read full description
The image shows a map of the United States with the rates of travel from 1857. The map is filled with various shades of blue, indicating the varying levels of travel across the country. The text on the map provides further information about the rates, such as the number of people living in each state and the average temperature in degrees Celsius.