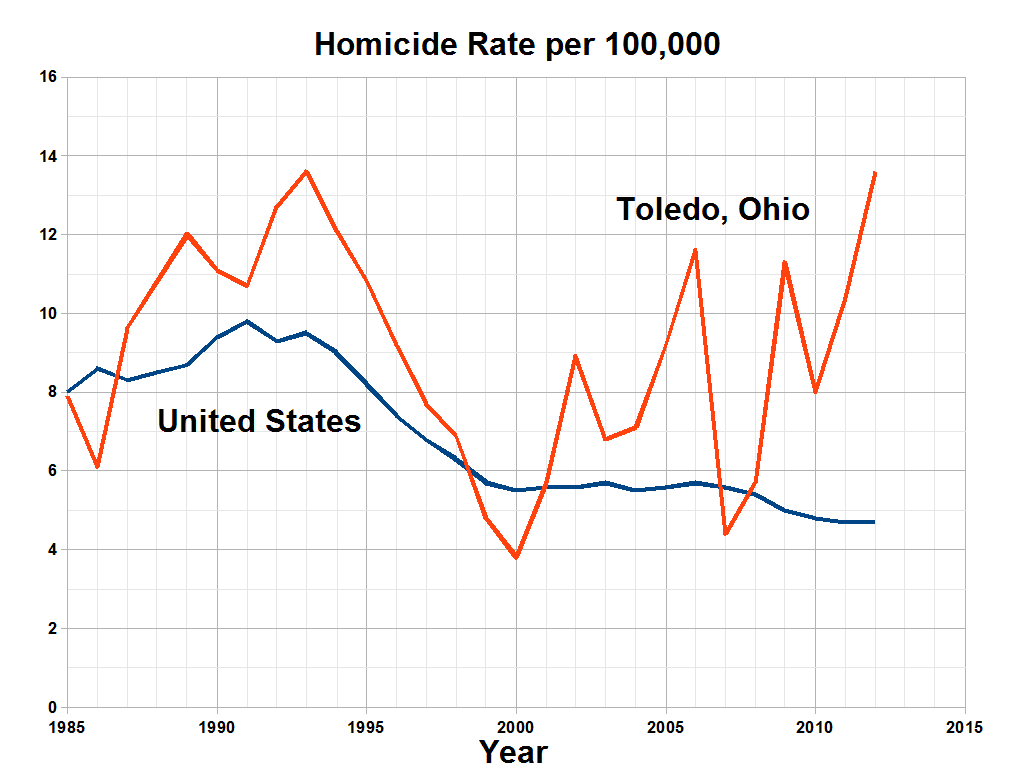
The image shows a graph depicting the homicide rate per 100,000 in Toledo, Ohio.
Read full description
The image shows a graph depicting the homicide rate per 100,000 in Toledo, Ohio. The graph is composed of two lines, one in blue and one in red, that represent the rate of homicide in each state. The blue line represents the rate, while the red line indicates the rate. The text on the graph provides further information about the data.