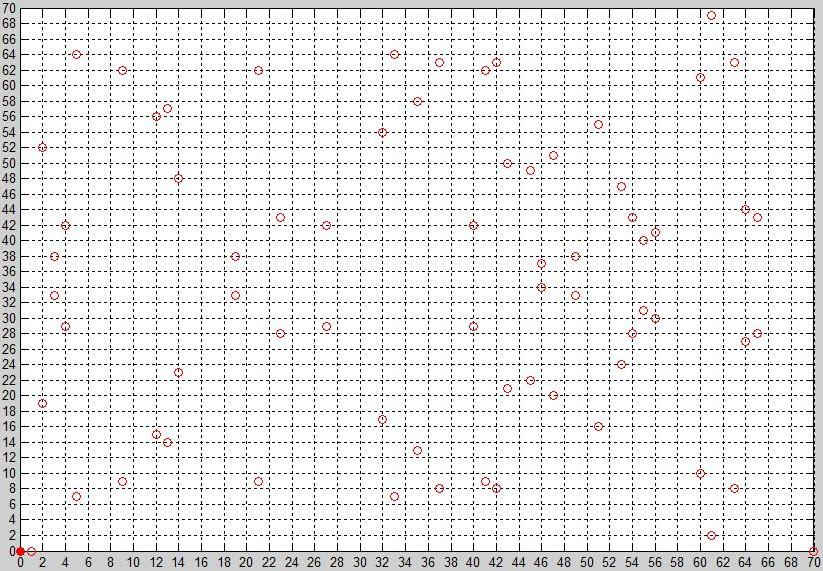
The image shows a graph paper with a line graph on it, displaying the number of people who have been diagnosed with cancer.
Read full description
The image shows a graph paper with a line graph on it, displaying the number of people who have been diagnosed with cancer. The graph is composed of a series of points connected by a line, with each point representing a different number of patients. The points are labeled with numbers, indicating the severity of the situation.