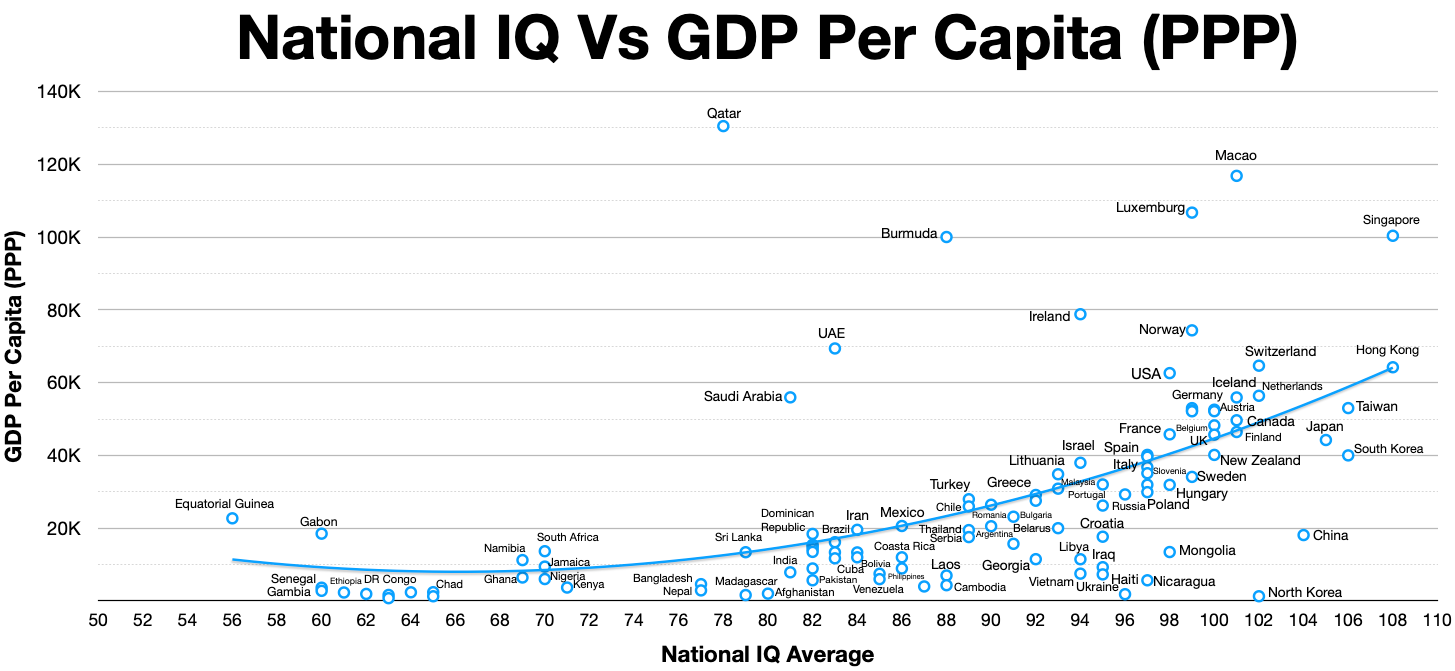
The image shows a graph on a white background with text that reads "National IQ vs GDP Per Capita (PPP)".
Read full description
The image shows a graph on a white background with text that reads "National IQ vs GDP Per Capita (PPP)". The graph is divided into two sections, one labeled "IQ" and the other labeled "GDP per Capita". The x-axis of the graph shows the GDP per capita, while the y-axis shows the national IQ. The graph also includes a legend that explains the meaning of the colors used in the graph.