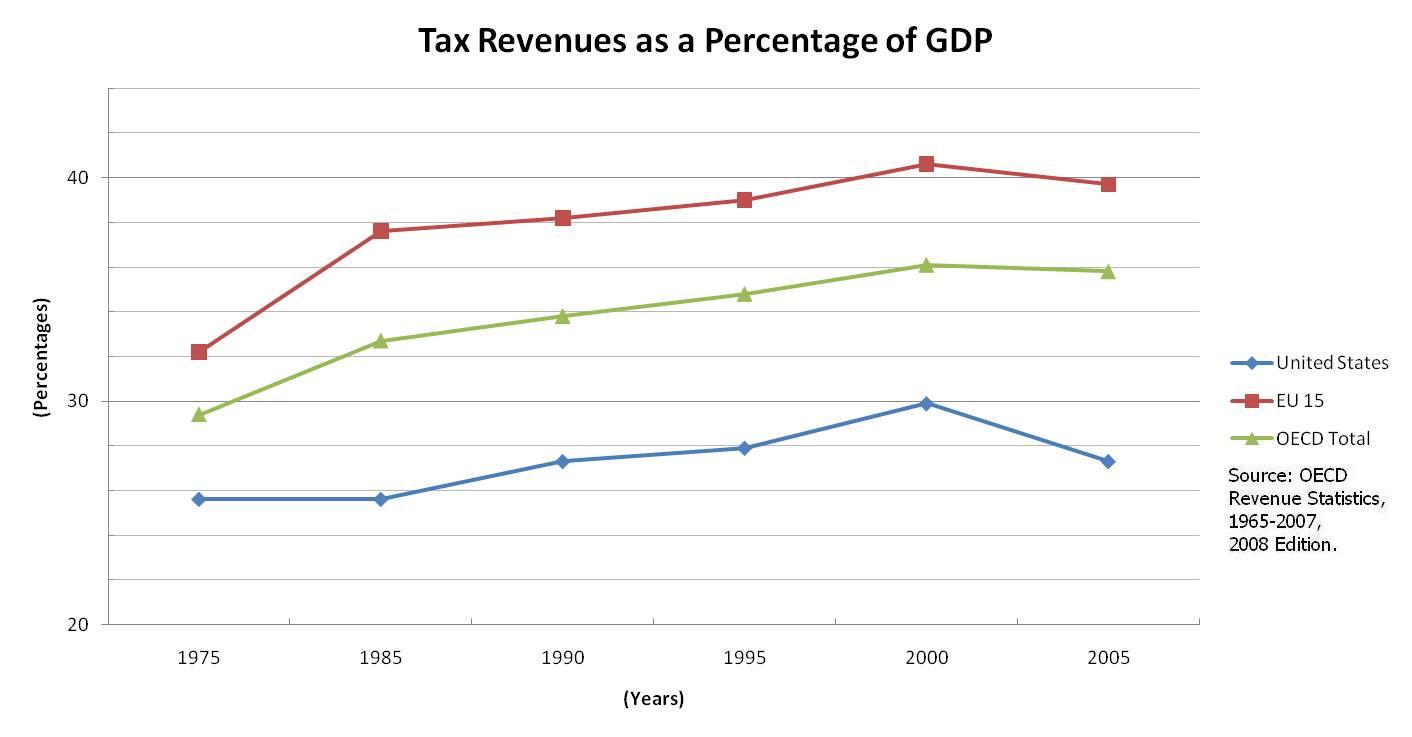
The image shows a graph on a white background with text that reads "tax revenues as a percentage of GDP".
Read full description
The image shows a graph on a white background with text that reads "tax revenues as a percentage of GDP". The graph is composed of several lines, each representing a different percentage of the Gross Domestic Product (GDP). The x-axis of the graph is labeled with the years, while the y-axis is labeled as the percentage. The graph shows a steady increase in tax revenues over time.