Read full description
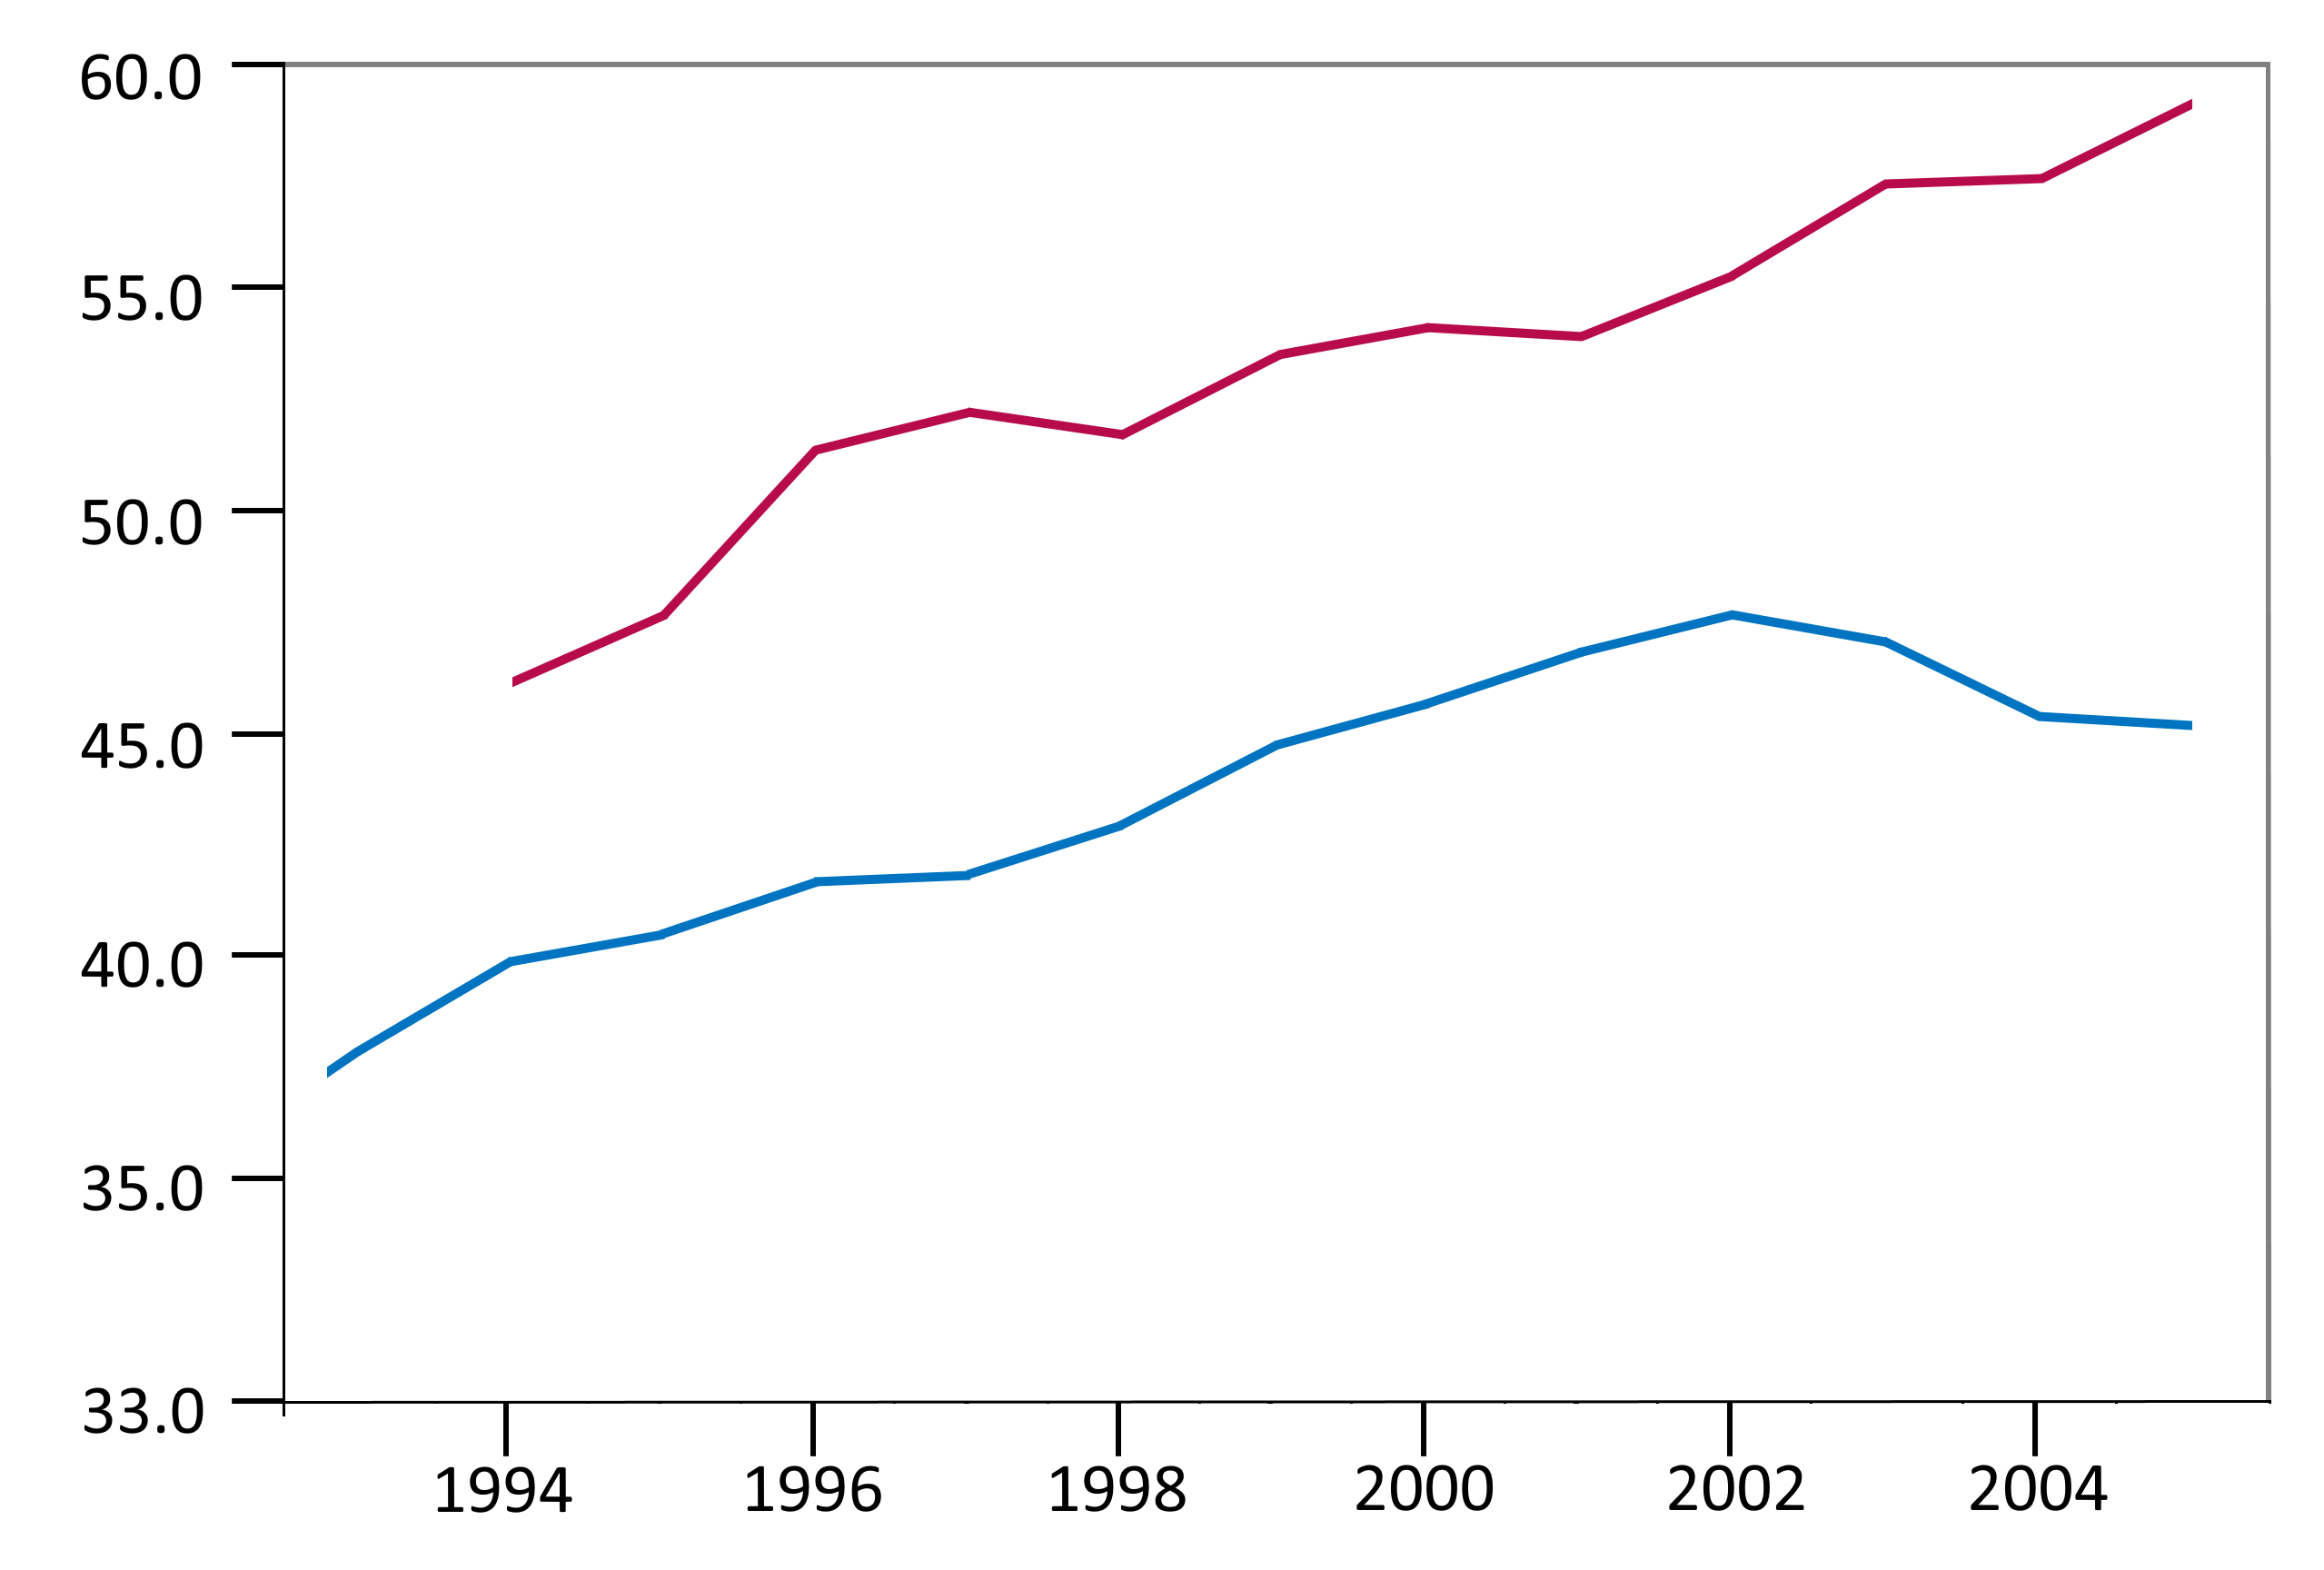
The image shows a line graph on a white background with two lines, one in blue and one in red, representing the number of people who have been diagnosed with cancer. The graph is labeled with the title "Number of People Who Have Been Diagnosed with Cancer".