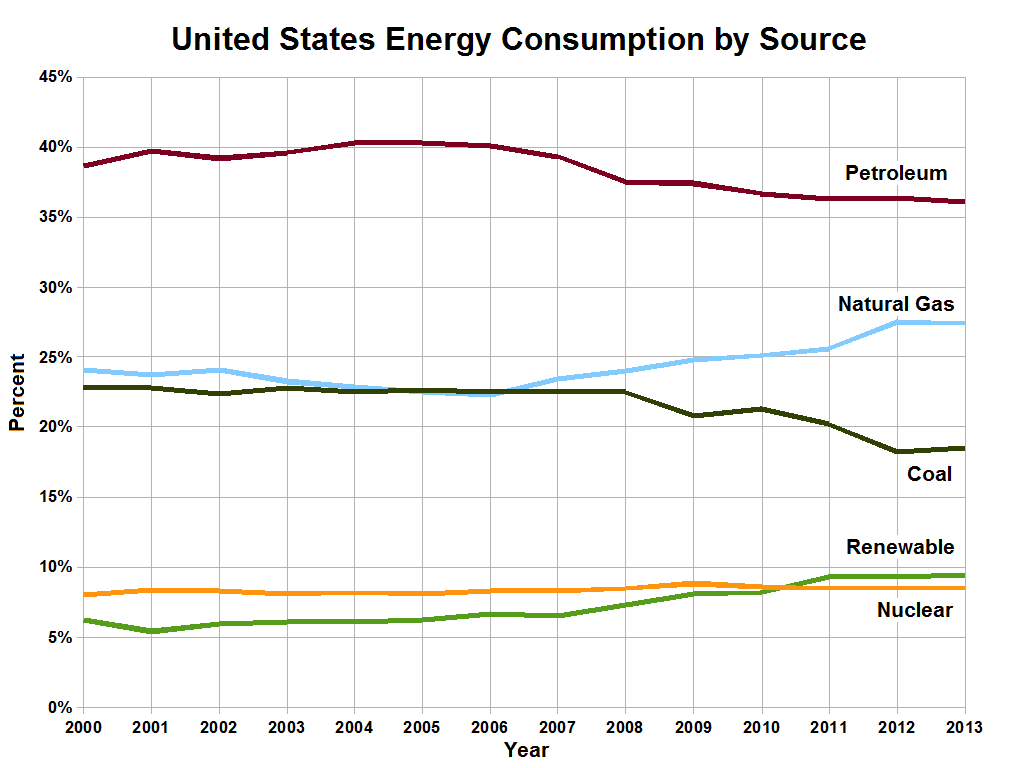
The image shows a graph depicting the United States energy consumption by source.
Read full description
The image shows a graph depicting the United States energy consumption by source. The graph is composed of several lines, each representing a different source of energy, such as coal, natural gas, and renewable energy. The text accompanying the graph provides further information about the consumption of each source.