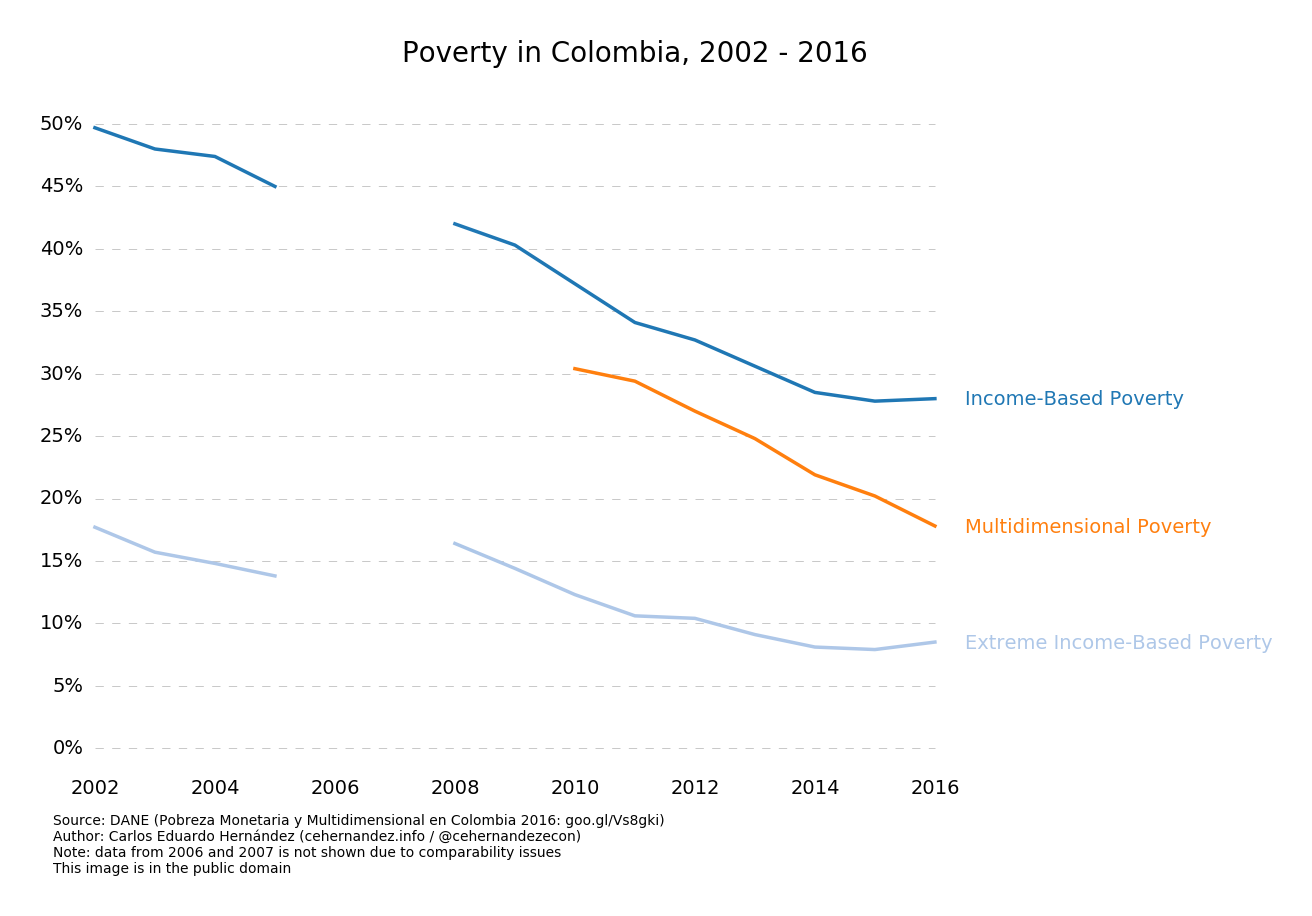
The image shows a graph depicting the poverty in Colombia from 2002 to 2016.
Read full description
The image shows a graph depicting the poverty in Colombia from 2002 to 2016. The graph is composed of several lines, each representing a different year, with the height of each line indicating the amount of poverty in that year. The text accompanying the graph provides further information about the data, such as the total number of people living in each year and the percentage of income-based poverty.