Public domain photos
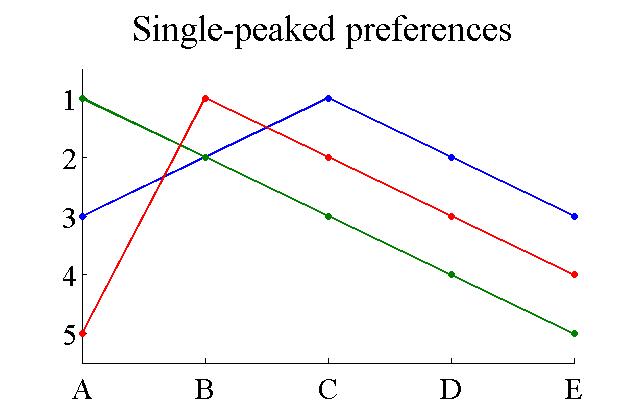
The image shows a single-peaked preference graph with a white background. The graph is composed of two lines, one in blue and one in green, with text written on it. The blue line is a line that starts at the bottom and gradually increases to the top, indicating a decrease in the number of people who have been diagnosed with cancer.
 Open in library