Public domain photos
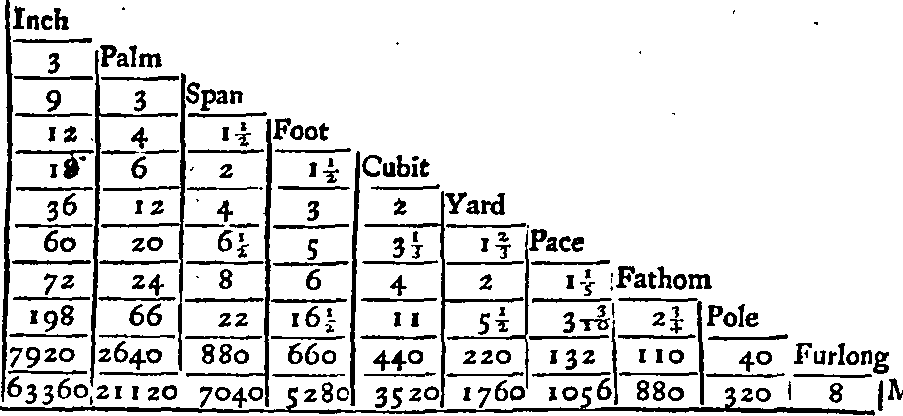
The image shows a black and white drawing of a table with numbers and text written on it, which appears to be a diagram of the number of people who have been diagnosed with cancer. The table is divided into columns and rows, with each row representing a different number. The numbers range from 0 to 9, and the text is written in a bold font.
 Open in library