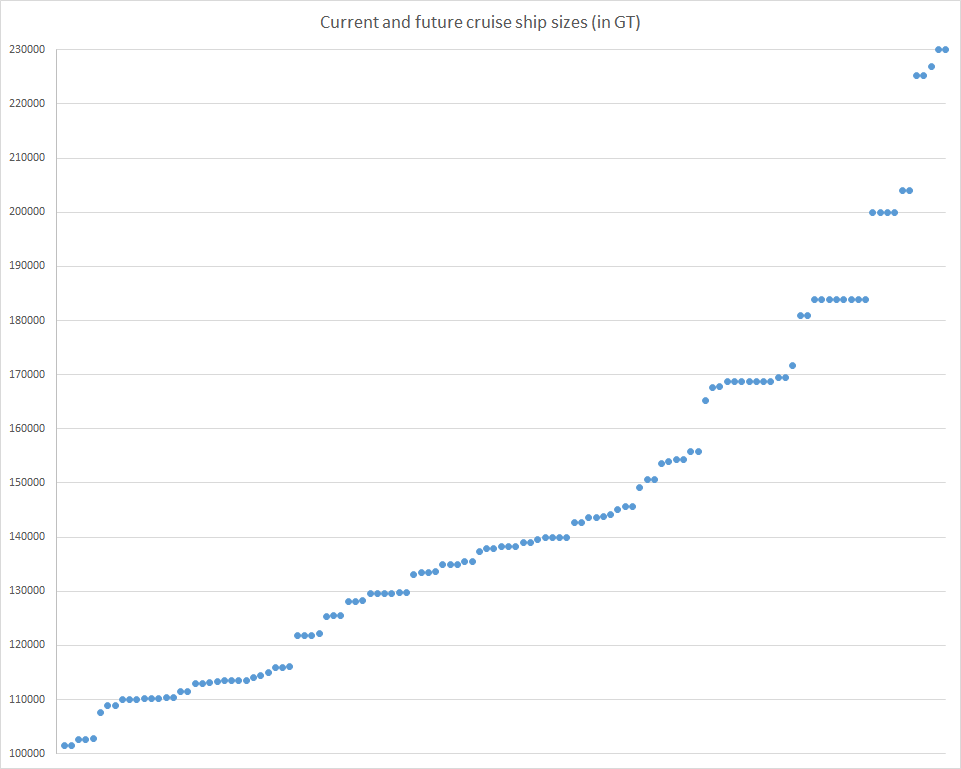
The image shows a computer screen with a graph depicting the current and future cruise ship sizes in G1.
Read full description
The image shows a computer screen with a graph depicting the current and future cruise ship sizes in G1. The graph is composed of a series of points connected by a line, with the x-axis representing the time period and the y-axis indicating the ship size. The points are labeled with the corresponding ship size, ranging from 0 to 100.