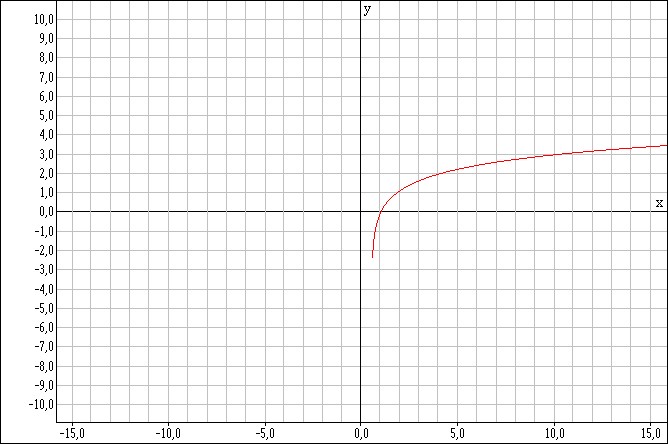
The image shows a graph paper with a red line plotted on it, along with numbers and text at the top and bottom.
Read full description
The image shows a graph paper with a red line plotted on it, along with numbers and text at the top and bottom. The graph appears to be a graphing function, with the x-axis representing the time and the y-axis indicating the slope of the graph.