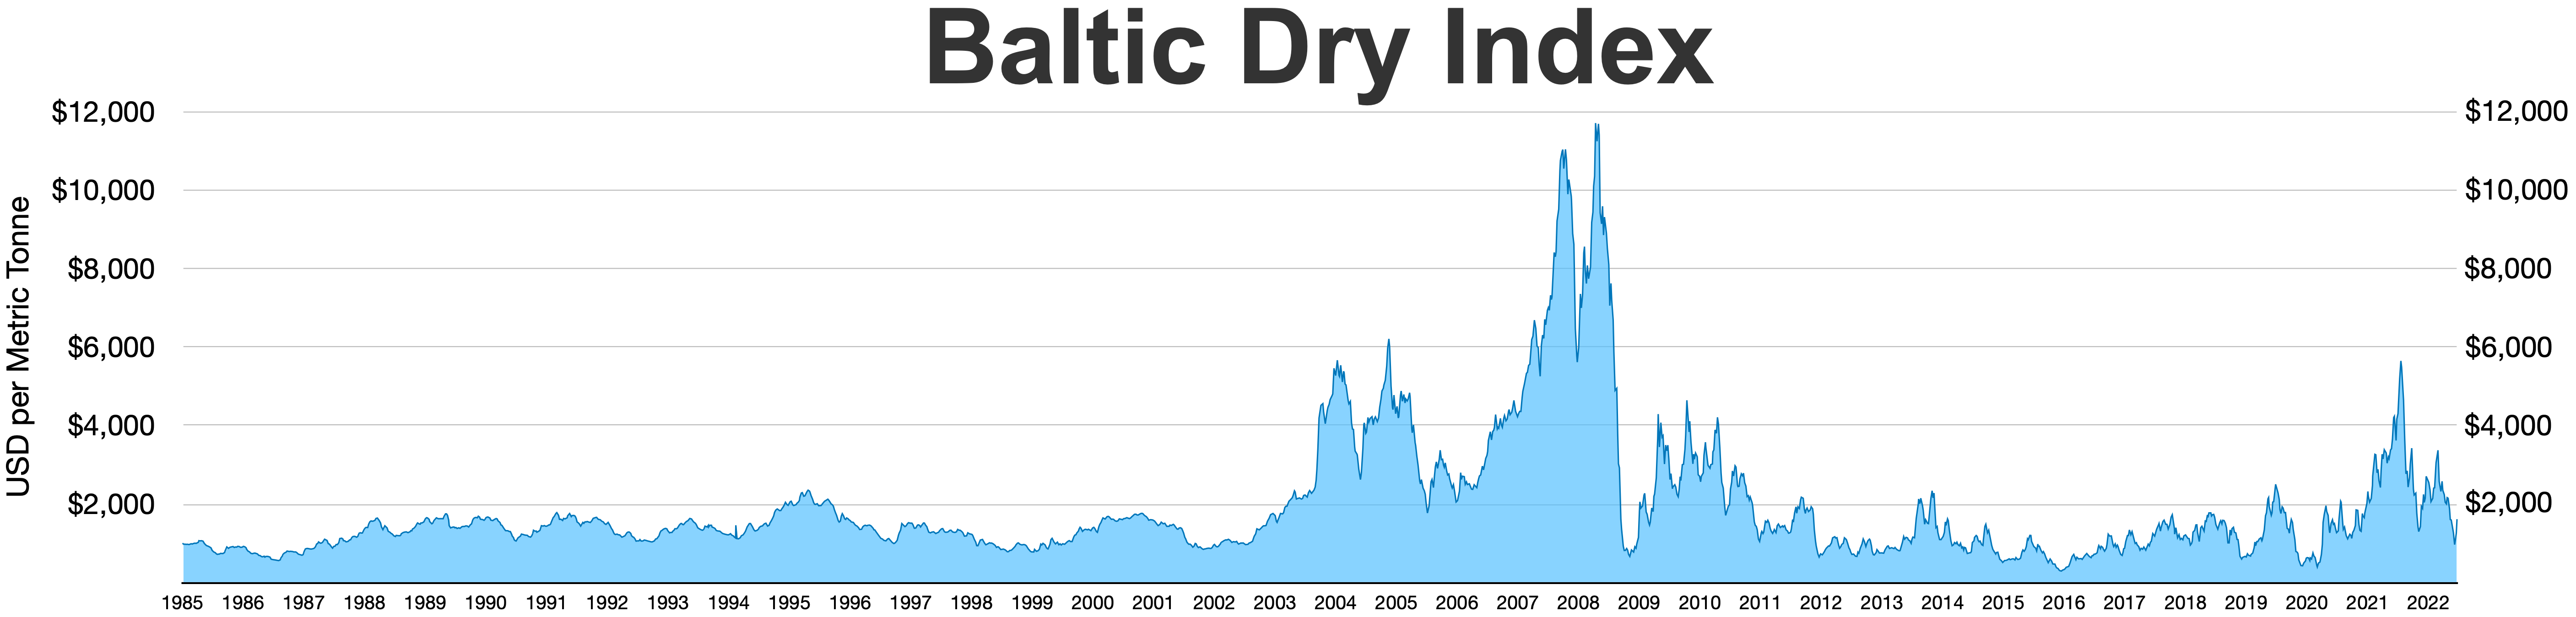
The image shows a graph of the Baltic Dry Index on a white background.
Read full description
The image shows a graph of the Baltic Dry Index on a white background. The graph is composed of a series of points connected by a line, with the x-axis representing the days of the week and the y-axis indicating the index. The points are labeled with the index name and the index number, and the graph is accompanied by text that provides further information about the data.