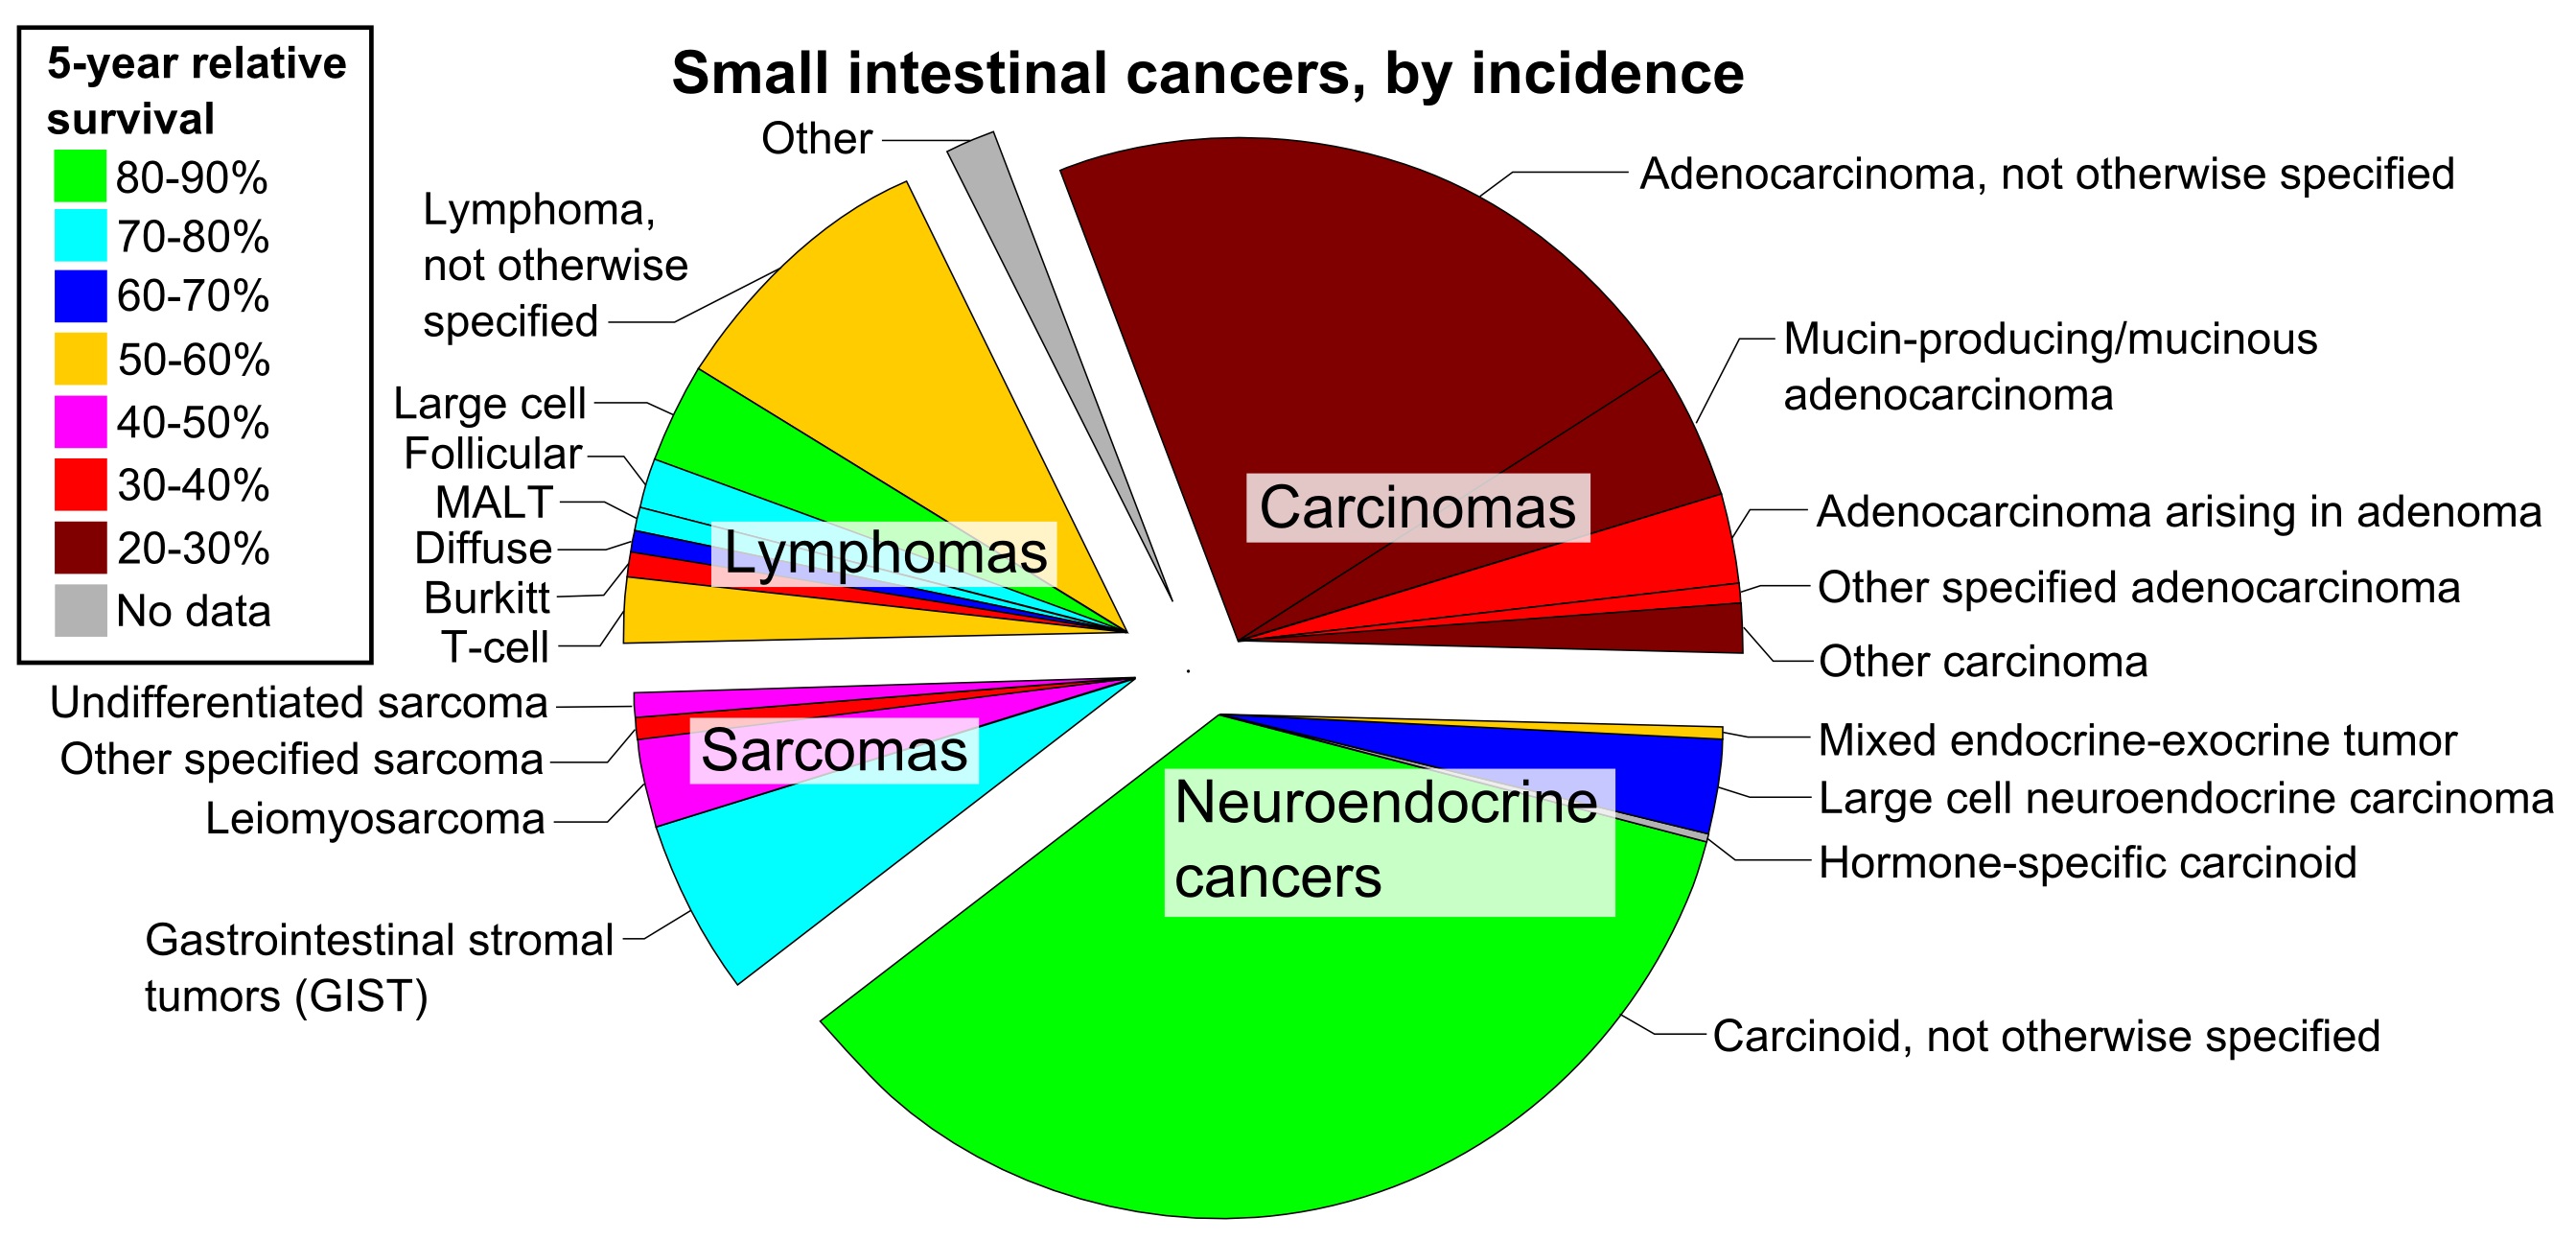
The image shows a pie chart depicting the percentage of small intestinal cancers by incidence.
Read full description
The image shows a pie chart depicting the percentage of small intestinal cancers by incidence. The chart is divided into sections, each representing a different type of cancer, such as cancerous tumors, lung cancer, and cancerous diseases. The size of each section indicates the relative incidence of each type, with the largest section representing cancerous tumor and the smallest section representing lung cancer.