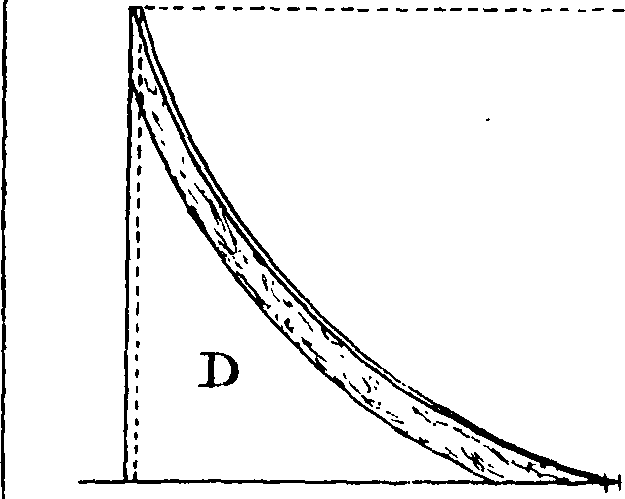
The image shows a black and white drawing of a curve with the letter 'D' on it, which is likely a representation of the demand curve.
Read full description
The image shows a black and white drawing of a curve with the letter 'D' on it, which is likely a representation of the demand curve. The graph is composed of a series of points connected by a line, with the x-axis representing the demand and the y-axis indicating the slope of the curve.