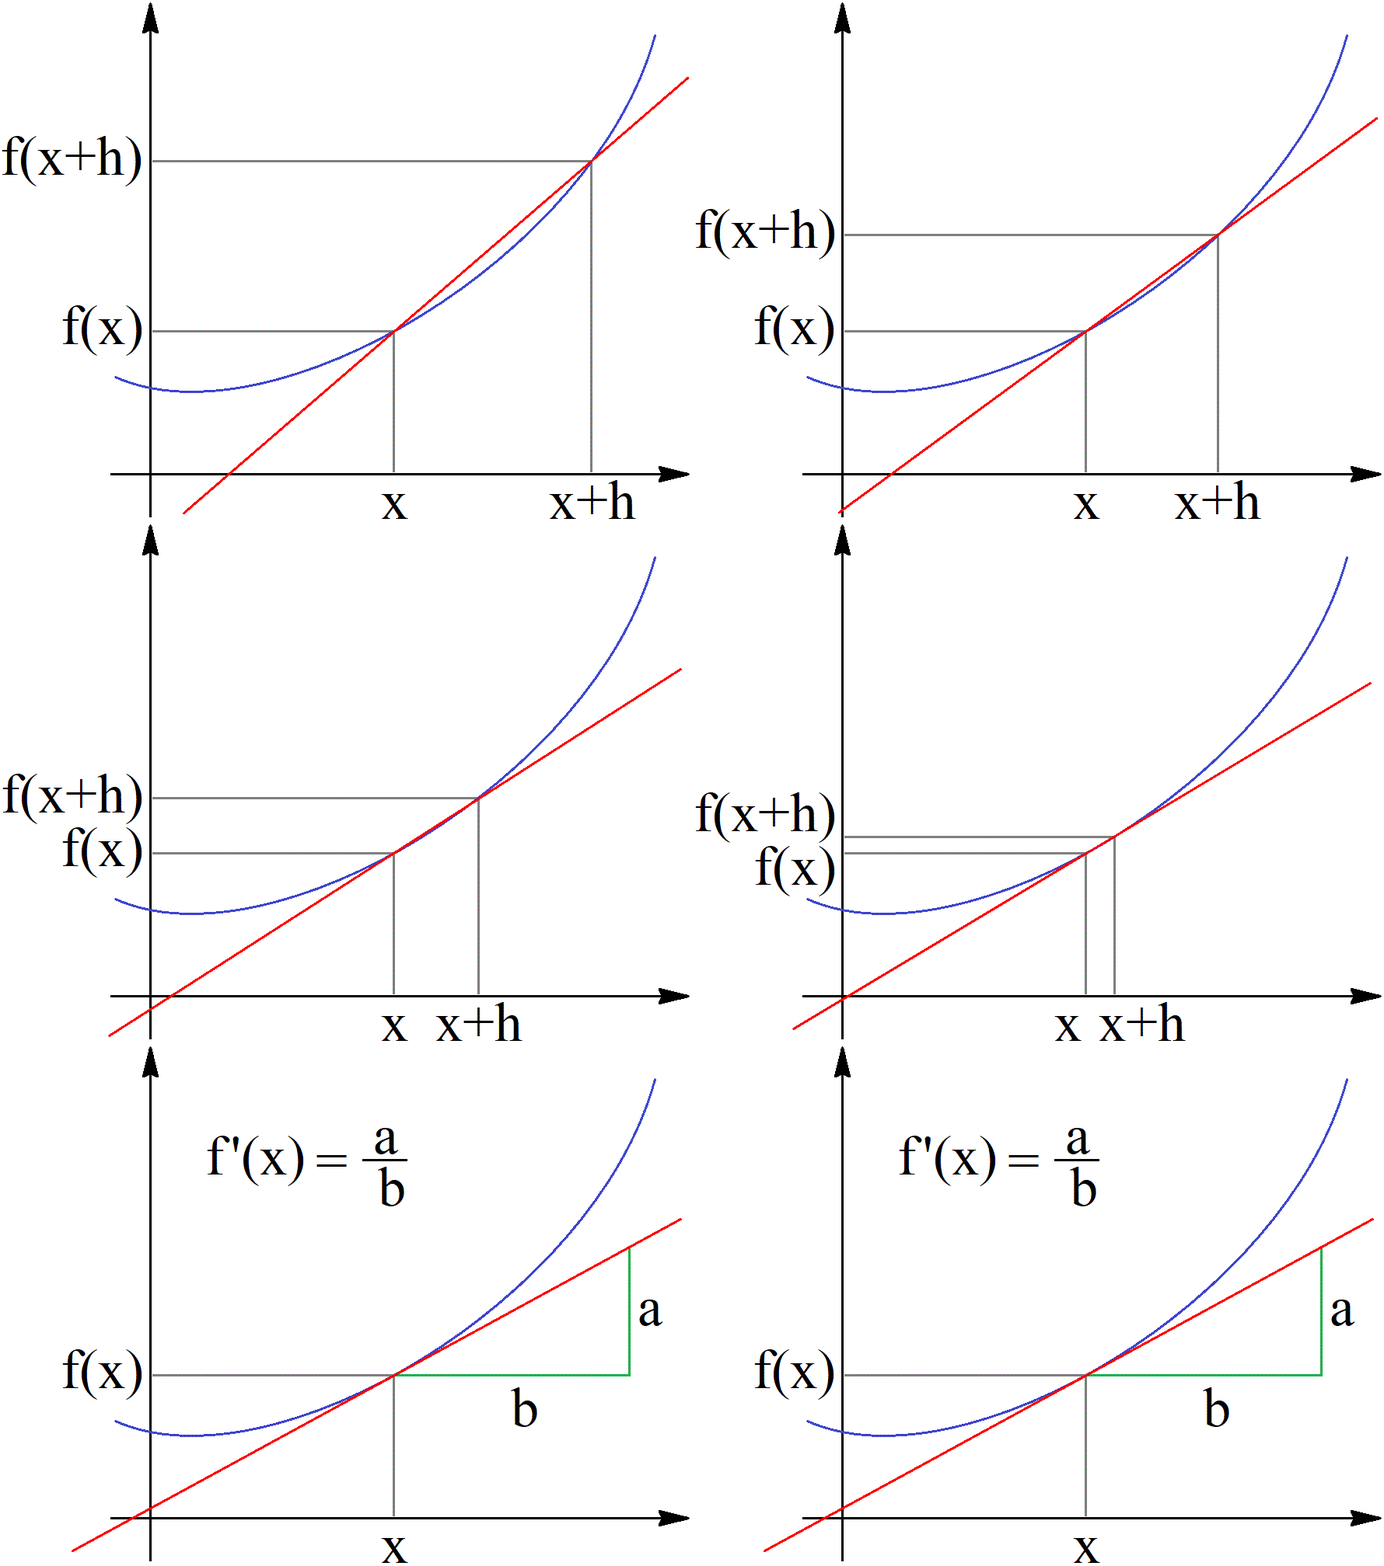
The image shows a graph of the x-axis and y-axis of a function on a white background, with the x and y axes of the graph clearly visible.
Read full description
The image shows a graph of the x-axis and y-axis of a function on a white background, with the x and y axes of the graph clearly visible. The graph is a representation of the relationship between the two variables, and the text accompanying it provides further information about the function.